3-D seismic data: time and horizon slices
| Exploring for Oil and Gas Traps | |

| |
| Series | Treatise in Petroleum Geology |
|---|---|
| Part | Predicting the occurrence of oil and gas traps |
| Chapter | Interpreting 3-D seismic data |
| Author | Geoffrey A. Dorn |
| Link | Web page |
| Store | AAPG Store |
The time slice is the first step toward 3-D interpretation of a 3-D seismic volume. A time-slice view of the data is an improvement over vertical sections for the interpretation of depositional systems because it provides the opportunity to see a portion of depositional systems in map view. This view is key to interpreting these systems because it allows a view of the morphology of the system, which facilitates its recognition.
Structural effects
A time slice provides at best an image of a small portion of a depositional system. Subsequent structural deformation of the depositional surface can mean that only a small portion of a depositional system is imaged on a time slice. In fact, as the structural relief increases, the anomalies on the time slice associated with the structure quickly dominate the image.
Horizon slices
One way to improve the imaging of the paleodepositional system is to create horizon slices through the 3-D volume. The interpreted reflection (horizon) is an approximation of a paleodepositional surface. Within the time interval where reflections are approximately conformable to the interpreted horizon in three dimensions, the shape of the horizon surface is a reasonable description of the shape of the paleodepositional surfaces.
Example vertical slice
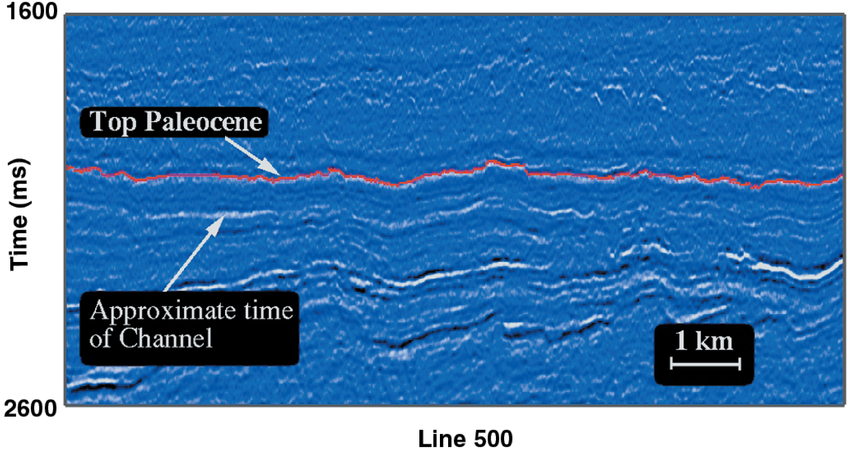
Figure 1 . Copyright: Dorn;[1] courtesy SEG.
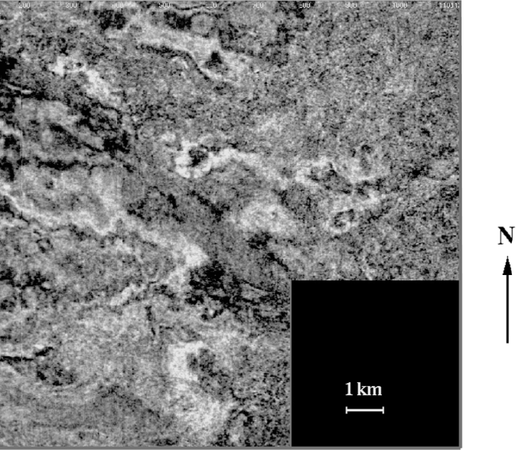
Figure 2 . Copyright: Dorn;[1] courtesy SEG.
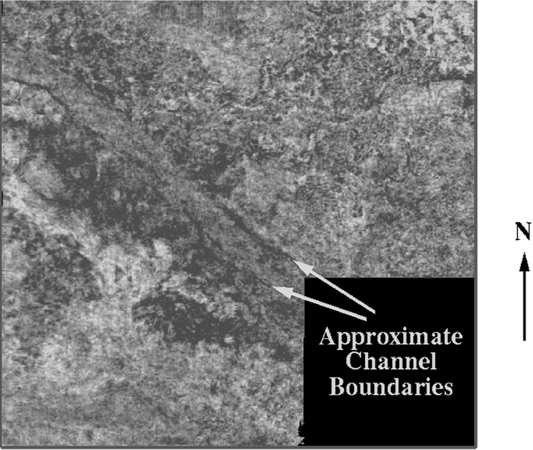
Figure 3 . Copyright: Dorn;[1] courtesy SEG.


Figures 1, 2, and 3 illustrate the value of the horizontal slice view of the data. Figure 1 is a portion of a vertical seismic section from a 3-D seismic survey in the North Sea. The interpreted horizon, at approximately 2 seconds, is the Top Paleocene. Approximately 120 ms below this, at about the level indicated by the arrows, the section crosses a 1-km-wide Paleocene deep-water turbidite channel.
Example time slice
Figure 2 is a time slice that intersects a portion of the channel. On both the vertical section (Figure 1) and the time slice, the channel is difficult to interpret, even though the feature is quite large. Most of the amplitude patterns on the time slice are associated with structure, not stratigraphy.
Example horizon slice
Figure 3 is a horizon slice 120 ms below the Top Paleocene horizon. The shape of the horizon slice is defined by the shape of the Top Paleocene horizon. This surface is shifted 120 ms down, and the seismic amplitudes are extracted where the shifted surface intersects the 3-D volume of data. The 1-km-wide channel is unmistakable on this view of the data, and both edges of the channel are readily interpretable.
See also
References
External links
| find literature about 3-D seismic data: time and horizon slices |