File:Log-analysis-applications fig3.png
Jump to navigation
Jump to search
Size of this preview: 712 × 600 pixels. Other resolutions: 285 × 240 pixels | 937 × 789 pixels.
Original file (937 × 789 pixels, file size: 19 KB, MIME type: image/png)
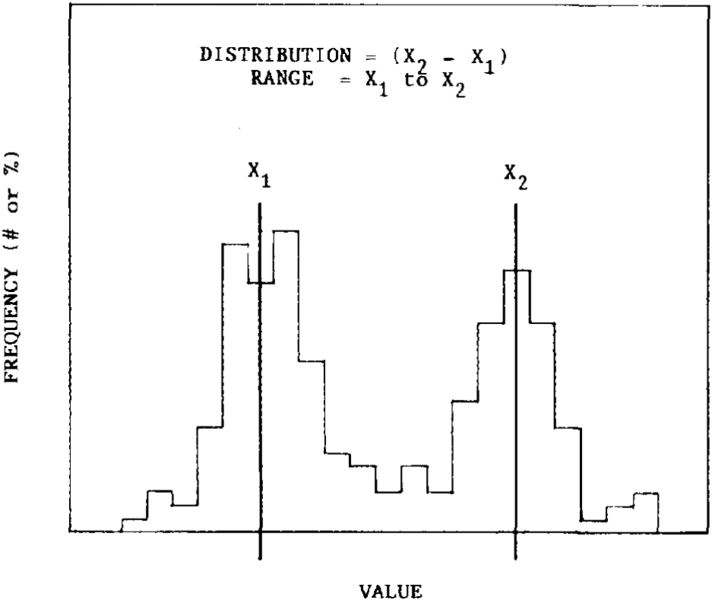
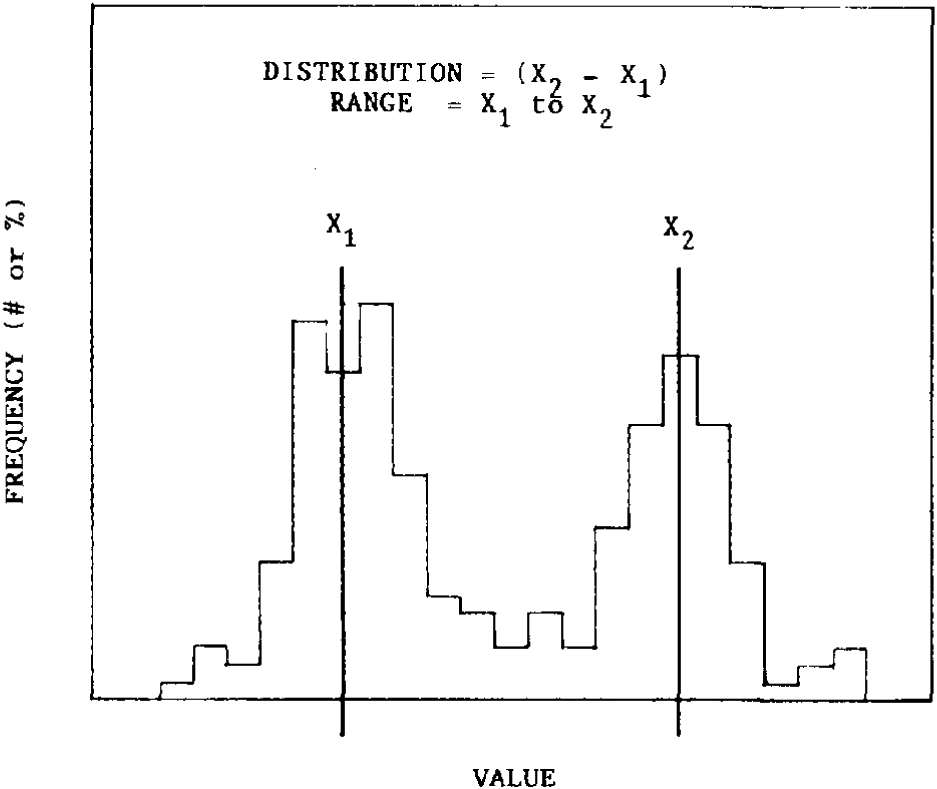
A histogram display of a traces value range. Frequency nodes in a trace's data values (<italic>x</italic>1, and <italic>x</italic>2) within a given formation are related to geology. Node values are usually consistent and mappable for that interval if observed in multiple wells in an area. If node values are atypical for a given well due to tool miscalibration, a correct distribution and range can be determined and the trace normalized.
File history
Click on a date/time to view the file as it appeared at that time.
| Date/Time | Thumbnail | Dimensions | User | Comment | |
|---|---|---|---|---|---|
| current | 16:36, 14 January 2014 | | 937 × 789 (19 KB) | Importer (talk | contribs) | A histogram display of a traces value range. Frequency nodes in a trace's data values (<italic>x</italic><sub>1</sub>, and <italic>x</italic><sub>2</sub>) within a given formation are related to geology. Node values are usually consistent and mappable ... |
You cannot overwrite this file.
File usage
The following page uses this file: