File:Mapping-with-two-dimensional-seismic-data fig2.png
Jump to navigation
Jump to search

Size of this preview: 800 × 549 pixels. Other resolutions: 320 × 219 pixels | 939 × 644 pixels.
Original file (939 × 644 pixels, file size: 47 KB, MIME type: image/png)
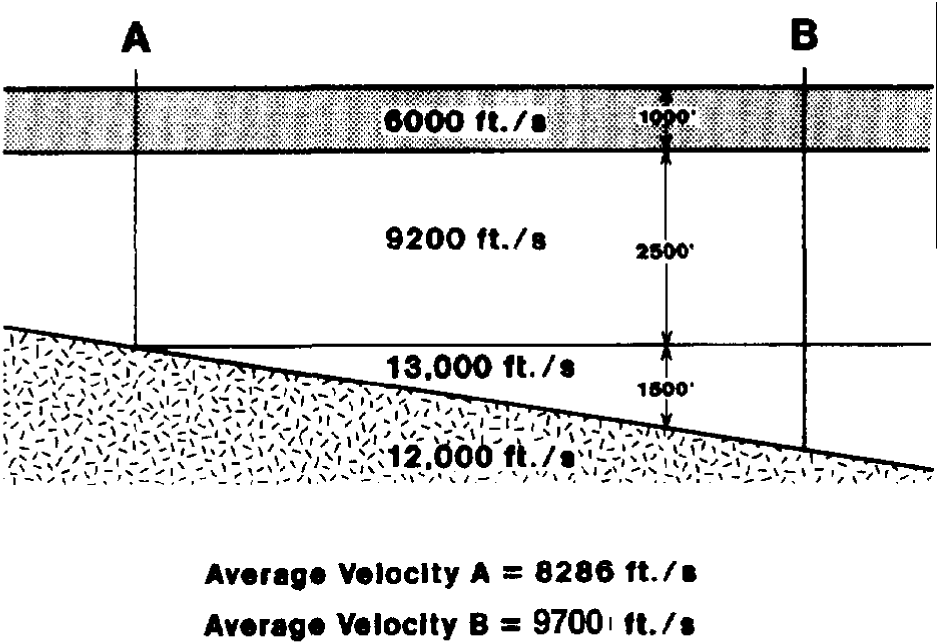
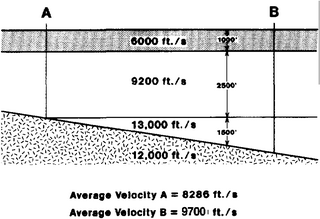
(a) Crude base map illustrating seismic line intersections. (b) Table showing misties at seismic line intersections (times in milliseconds). Circled lines constitute a group having small misties. A group can be used as a base to which times on all other lines are adjusted. For example, times on line A561–80 could be shifted down about 52 msec.
File history
Click on a date/time to view the file as it appeared at that time.
| Date/Time | Thumbnail | Dimensions | User | Comment | |
|---|---|---|---|---|---|
| current | 19:36, 14 January 2014 | | 939 × 644 (47 KB) | Importer (talk | contribs) | (a) Crude base map illustrating seismic line intersections. (b) Table showing misties at seismic line intersections (times in milliseconds). Circled lines constitute a group having small misties. A group can be used as a base to which times on all othe... |
You cannot overwrite this file.
File usage
The following page uses this file: