Difference between revisions of "Rate of penetration"
| Line 85: | Line 85: | ||
* [[Wellsite math]] | * [[Wellsite math]] | ||
* [[Wellsite safety]] | * [[Wellsite safety]] | ||
| − | * [[Mudlogging: | + | * [[Mudlogging: the mudlog]] |
* [[Well planning]] | * [[Well planning]] | ||
* [[Measurement while drilling]] | * [[Measurement while drilling]] | ||
Revision as of 21:05, 17 January 2014
| Development Geology Reference Manual | |

| |
| Series | Methods in Exploration |
|---|---|
| Part | Wellsite methods |
| Chapter | Rate of penetration |
| Author | Scott Boone |
| Link | Web page |
| Store | AAPG Store |
Rate of penetration (ROP) logs are recorded at the wellsite as the well is being drilled. The ROP can be expressed as either distance drilled per unit of time (feet per hour) or time per distance drilled (minutes per foot).
Measurement techniques[edit]
Rate of penetration is calculated by measuring the length of time required to drill length::1 ft of depth. This is typically done by reading the chart on the geolograph.
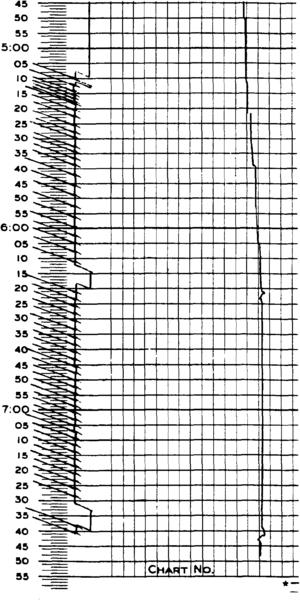
The geolograph, or drilling recorder, mechanically monitors depth and records drilling parameters in time. These parameters are recorded on a paper chart, graduated in minutes, that is wrapped around a drum. The drum rotates one revolution in 8, 12, or 24 hr. To record depth, a small cable is run from the geolograph to the top of the kelly via a pulley on the crown of the derrick (see Land rigs). Kelly height can then be measured and directly related to bit depth. As each foot is drilled, an ink pen on the geolograph places a small mark on the chart. Every length::5 ft the pen places a larger mark on the chart (Figure 1).
Other more advanced monitoring techniques utilize computers and digital encoders to monitor depth. These systems are typically stand-alone. The digital encoder or transducer is attached to a part of the rig that moves in proportion to the movement of the drill string. Common attachment points are the drill line, drawworks drum, or crown sheaves.
Errors and sensitivity[edit]
With standard equipment, most errors in ROP are related to the operation of the geolograph. When a connection is made, the driller should disengage the geolograph recorder before picking up a new joint of pipe. The recorder must then be reengaged when drilling resumes. Unless this operation is performed properly, the rate of penetration just prior to or after a connection can be questionable. In addition, high winds can whip the geolograph recording cable, causing extra footage to be recorded. This results in an apparent increase in ROP. It is not unknown for the drilling hands to “gig” or pull on the recording cable, causing a similar apparent increase in ROP.
Other sources of error include
- Hole fill
- Pipe stretch
- Sticking pipe
All of these errors must be “backed out” to maintain an accurate depth record. The depth can be checked by periodically strapping out of the hole (each stand is measured with a steel tape as it is pulled or tripped out of the hole) and making a depth correction to the geolograph if necessary.
Computers can measure depth and ROP with a high degree of accuracy and sensitivity. However, it must be remembered that virtually all methods of measuring ROP depend upon surface responses to the performance of the drill bit. Because the drill string stretches in proportion to the weight on bit (WOB), highly sensitive ROP logs can appear erratic as a result of the driller slacking off on the brake. For this reason, computer logs are frequently averaged to reflect the ROP and drillability of the formation.
Applications[edit]
Rate of penetration logs serve as historical records of drilling performance and can aid in optimizing drilling operation and formation evaluation.
Bit selection[edit]
Hard, compacted formations drill slow and consistent. Soft formations drill fast and have erratic ROP.
Mud weight (Pore Pressure)[edit]
The drilling rate of shale is very sensitive to the pressure balance between the shale and wellbore. Shales drilled underbalanced are characterized by fast drilling, high gas readings, and large cuttings. Shales drilled overbalanced are characterized by slow drilling, low gas readings, and small cuttings. Recognizing this relationship can aid in the selection of a mud weight to optimize drilling speed.
Correlation[edit]
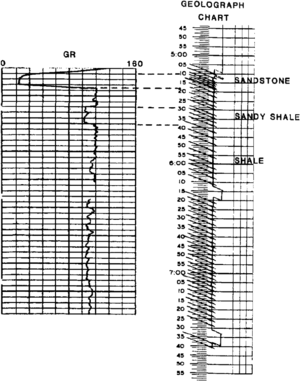
The ROP log is the first source of data that can be used to correlate to nearby wells. This is done by comparing ROP to gamma ray or SP curves (Figure 2). This correlation can help determine structural and stratigraphic position and is used to predict when the well will reach a zone of interest.
Lithology[edit]
Shales generally drill slower than sandstones or carbonates, and as a result, ROP logs tend to reflect indirectly the lithology of the formation.
Relative porosity[edit]
Porosity in sandstone is qualitatively inferred by observing the ROP in shale and comparing that to the ROP in a known sandstone interval. Porosity in carbonates is inferred by comparing the relatively slow ROP in rocks having low matrix porosity to rocks having higher porosity and faster ROP. This comparison requires that the prevailing drilling conditions (mud weight, bit condition, WOB, and rotary speed) are consistent.
Normalized rate of penetration (Nrop)[edit]
When comparing ROP curves from different wells, a normalized curve (NROP) must be made for each well. Actual recorded values are corrected back (or normalized) to base values for each bit run using the following equation:
where
- n = normal value
- o = observed value
- M = threshold weight, or the WOB needed to cause formation failure, generally taken from tables
- RPM = bit rotating speed, in rotations per minute
- L = rotary exponent, taken from tables
- dPb = pressure drop at bit, in psi; the pump pressure needed to push mud through the bit nozzels at a particular flow rate
- Q = flow rate in gallons per minute of mud through the system
See also[edit]
- Drilling problems
- Introduction to wellsite methods
- Wellsite math
- Wellsite safety
- Mudlogging: the mudlog
- Well planning
- Measurement while drilling


