Difference between revisions of "File:Figure1 2019-20 Comm Rept.jpg"
Jump to navigation
Jump to search
(U.S. total oil production forecasts. Solid lines indicate actual production, dashed lines show forecast production through the end of 2021. Data Source: U.S. Energy Information Administration.) |
(No difference)
|
Latest revision as of 18:40, 5 April 2021
U.S. total oil production forecasts. Solid lines indicate actual production, dashed lines show forecast production through the end of 2021. Data Source: U.S. Energy Information Administration.
File history
Click on a date/time to view the file as it appeared at that time.
| Date/Time | Thumbnail | Dimensions | User | Comment | |
|---|---|---|---|---|---|
| current | 18:40, 5 April 2021 | 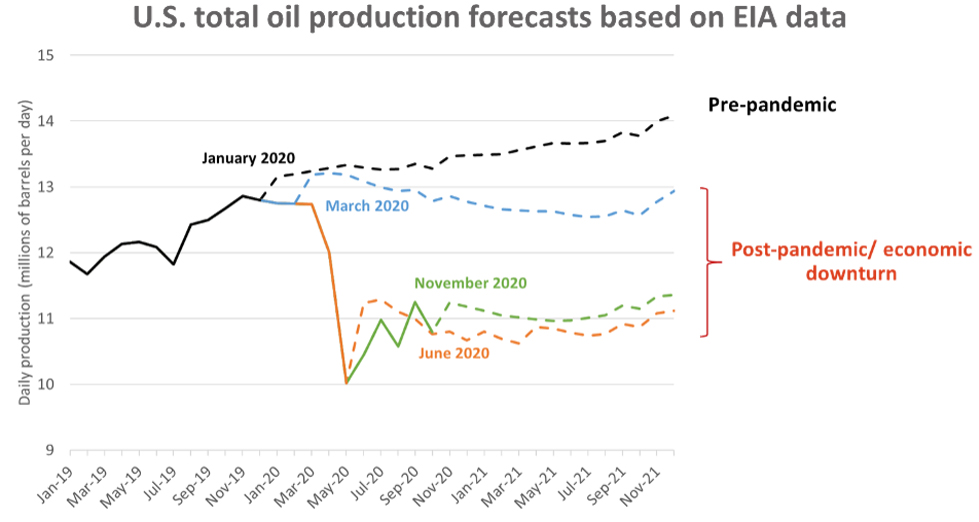 | 979 × 522 (133 KB) | Molyneux (talk | contribs) | U.S. total oil production forecasts. Solid lines indicate actual production, dashed lines show forecast production through the end of 2021. Data Source: U.S. Energy Information Administration. |
You cannot overwrite this file.
File usage
The following page uses this file: