Difference between revisions of "File:Figure3 2019-20 Comm Rept.jpg"
Jump to navigation
Jump to search
(Status of major U.S. tight gas plays. Data source: U.S. EIA, U.S. Tight gas production report (all y-axis values in billions of scf/day).) |
(No difference)
|
Latest revision as of 19:34, 5 April 2021
Status of major U.S. tight gas plays. Data source: U.S. EIA, U.S. Tight gas production report (all y-axis values in billions of scf/day).
File history
Click on a date/time to view the file as it appeared at that time.
| Date/Time | Thumbnail | Dimensions | User | Comment | |
|---|---|---|---|---|---|
| current | 19:34, 5 April 2021 | 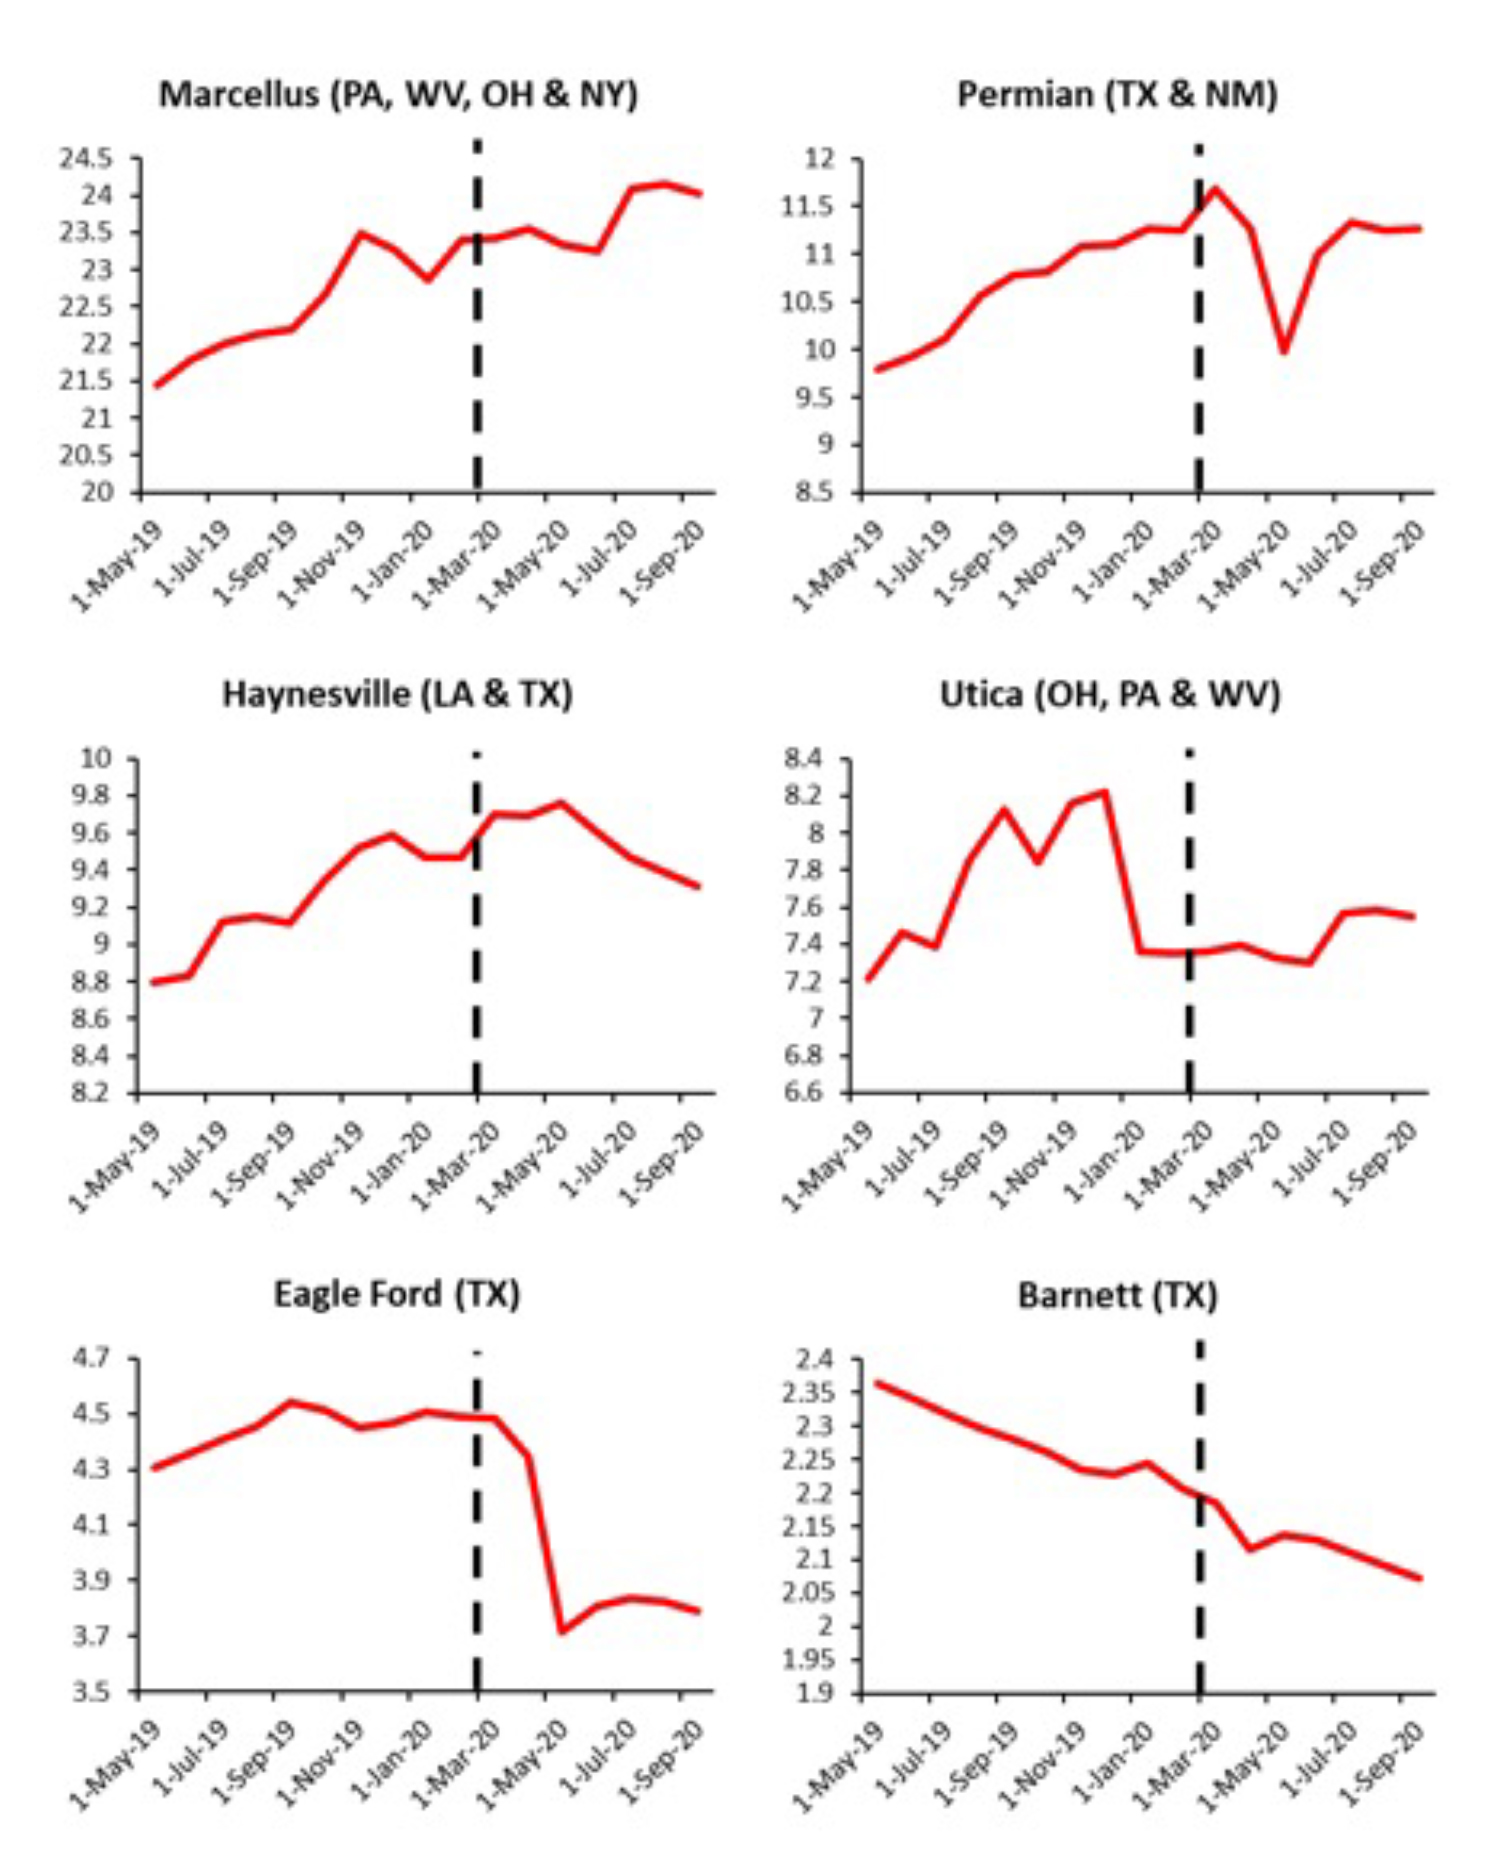 | 1,500 × 1,875 (495 KB) | Molyneux (talk | contribs) | Status of major U.S. tight gas plays. Data source: U.S. EIA, U.S. Tight gas production report (all y-axis values in billions of scf/day). |
You cannot overwrite this file.
File usage
The following page uses this file: