Difference between revisions of "Template:Annotated image/Extinction"
Jump to navigation
Jump to search
 Template documentation[create]
(testing annotated image) |
(No difference)
|
Latest revision as of 15:15, 23 January 2014

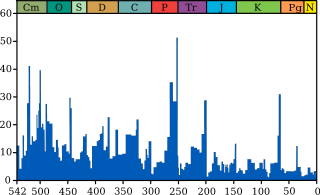
The blue graph shows the apparent percentage (not the absolute number) of marine animal genera becoming extinct during any given time interval. It does not represent all marine species, just those that are readily fossilized. The labels of the "Big Five" extinction events are clickable hyperlinks; see Extinction event for more details. (source and image info)
| Editors can experiment in this template's sandbox (create) and testcases (create) pages. Please add categories and interwikis to the /doc subpage. Subpages of this template. |