Difference between revisions of "3-D seismic data: the data cube"
FWhitehurst (talk | contribs) |
FWhitehurst (talk | contribs) |
||
| Line 14: | Line 14: | ||
| isbn = 0-89181-602-X | | isbn = 0-89181-602-X | ||
}} | }} | ||
| − | Seismic prospecting has been around since the 1920s and was almost exclusively two-dimensional until the mid-1980s. Three-dimensional techniques were experimented with as early as the 1940s but did not progress far until digital processing became common in the 1970s. Current worldwide seismic effort is estimated to be over 50% 3-D, and the percentage is growing rapidly. This would apply to dollar volume and/or acquisition effort. International (non-U.S.) seismic prospecting could be as high as 75% 3-D. We live in a 3-D world and now understand that 2-D | + | Seismic prospecting has been around since the 1920s and was almost exclusively two-dimensional until the mid-1980s. Three-dimensional techniques were experimented with as early as the 1940s but did not progress far until digital processing became common in the 1970s. Current worldwide seismic effort is estimated to be over 50% 3-D, and the percentage is growing rapidly. This would apply to dollar volume and/or acquisition effort. International (non-U.S.) seismic prospecting could be as high as 75% 3-D. We live in a 3-D world and now understand that 2-D seismic data is prone to many pitfalls and problems. A great advance of the last 25 years has been the development of the 3-D seismic technique, which has much more risk-reducing information content than an equivalent amount of 2-D seismic. |
==3-D advantages== | ==3-D advantages== | ||
Revision as of 22:38, 12 February 2014
| Exploring for Oil and Gas Traps | |

| |
| Series | Treatise in Petroleum Geology |
|---|---|
| Part | Predicting the occurrence of oil and gas traps |
| Chapter | Interpreting seismic data |
| Author | Christopher L. Liner |
| Link | Web page |
| Store | AAPG Store |
Seismic prospecting has been around since the 1920s and was almost exclusively two-dimensional until the mid-1980s. Three-dimensional techniques were experimented with as early as the 1940s but did not progress far until digital processing became common in the 1970s. Current worldwide seismic effort is estimated to be over 50% 3-D, and the percentage is growing rapidly. This would apply to dollar volume and/or acquisition effort. International (non-U.S.) seismic prospecting could be as high as 75% 3-D. We live in a 3-D world and now understand that 2-D seismic data is prone to many pitfalls and problems. A great advance of the last 25 years has been the development of the 3-D seismic technique, which has much more risk-reducing information content than an equivalent amount of 2-D seismic.
3-D advantages
What is the attraction of 3-D? Why do you want a 3-D survey rather than a (less expensive) grid of 2-D seismic lines? A3-D seismic survey has many advantages over a 2-D line or a grid of 2-D lines—even a dense one. [A2-D grid is considered dense if the line spacing is less than about 1/4 mile (1,320 ft; 400 m).] The advantages of 3-D include the following:
- True structural dip (2-D may give apparent dip)
- More and better stratigraphic information
- Map view of reservoir properties
- Much better areal mapping of fault patterns and connections and delineation of reservoir blocks
- Better lateral resolution (2-D suffers from a cross-line smearing, or Fresnel zone, problem)
Data sets
A 3-D seismic data set is a “cube” or volume of data; a 2-D seismic data set, on the other hand, is a panel of data. To interpret the 3-D data we need to investigate the interior of the cube. This is done almost universally on a computer due to the massive amounts of data involved. A3-D data set can range in size from a few tens of megabytes to several gigabytes—the equivalent of a library of information.
Data volume concept
To understand the concept of a volume of data, think of a room. Imagine the room divided up into points, each, say, one foot apart. Any particular point will have an (x, y, z) coordinate and a data value. The coordinate is the distance from a particular corner of the ceiling. We choose the ceiling so that z points down into the room. At any given point the data value is, say, the temperature, so we have temperature as a function of (x, y, z). As we move around the room to other points, the temperature changes—high near incandescent lights and low near a glass of ice water.
A3-D seismic data volume is like the room-temperature example except for two changes:
- The vertical axis is vertical reflection time, not depth.
- The data values are seismic amplitudes rather than temperature.
3-D data set example
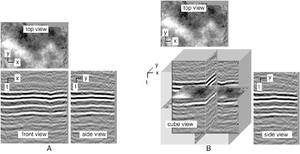
Let's take our example a step further. Think of a 3-D seismic data set as a box full of numbers, each number representing a measurement (amplitude, for example). Each number has an (x, y, z) position in the box. For any point in the middle of the box, three planes pass through it parallel to the top, front, and side of the box.
Figure 1 illustrates 3-D data from north Texas. It measures about 1.5 mi2 across the top. Figure 1A shows three views for a point in the middle of the box. The dark and light bands in the sections are related to rock boundaries. Keep in mind that seismic techniques detect edges. Figure 1B is a different view. It is a cube display with vertical and horizontal slices to show what is inside the data.
See also
- Phases of a seismic project
- Recurring themes
- Components of a 3-D seismic survey
- 3-D seismic data views
