Difference between revisions of "File:Multivariate-data-analysis fig2.png"
Jump to navigation
Jump to search
(Dendrogram (by aggregation). Starting from <italic>n</italic> samples, combine the two most similar samples (here 2 and 3). Then, combine the two nearest groups by either joining two samples or aggregating a third sample to the previous group of two (1...) |
(No difference)
|
Latest revision as of 00:51, 14 January 2014
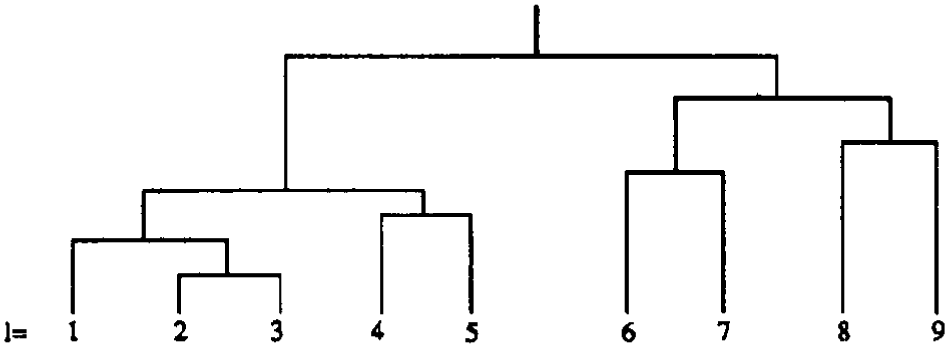
Dendrogram (by aggregation). Starting from <italic>n</italic> samples, combine the two most similar samples (here 2 and 3). Then, combine the two nearest groups by either joining two samples or aggregating a third sample to the previous group of two (1 is aggregated to 2 and 3). At the next step, 4 and S constitutes a new group, which is then aggregated to the former group (1, 2, 3). The aggregation process stops when there Is only one group left. In the last step, group (1, 2, 3, 4, 5) is aggregated to group (6, 7, 8, 9).
File history
Click on a date/time to view the file as it appeared at that time.
| Date/Time | Thumbnail | Dimensions | User | Comment | |
|---|---|---|---|---|---|
| current | 00:51, 14 January 2014 | 949 × 348 (7 KB) | Importer (talk | contribs) | Dendrogram (by aggregation). Starting from <italic>n</italic> samples, combine the two most similar samples (here 2 and 3). Then, combine the two nearest groups by either joining two samples or aggregating a third sample to the previous group of two (1... |
You cannot overwrite this file.
File usage
The following page uses this file: