Difference between revisions of "File:Key-economic-parameters fig3.png"
Jump to navigation
Jump to search
(Expected value profile plot. Expected value is plotted versus probability of success example for development well and multiwell extension project. Category:Economics and risk asseement) |
m (tpyo) |
||
| Line 1: | Line 1: | ||
Expected value profile plot. Expected value is plotted versus probability of success example for development well and multiwell extension project. | Expected value profile plot. Expected value is plotted versus probability of success example for development well and multiwell extension project. | ||
| − | [[Category:Economics and risk | + | [[Category:Economics and risk assessment]] |
Latest revision as of 19:20, 14 January 2014
Expected value profile plot. Expected value is plotted versus probability of success example for development well and multiwell extension project.
File history
Click on a date/time to view the file as it appeared at that time.
| Date/Time | Thumbnail | Dimensions | User | Comment | |
|---|---|---|---|---|---|
| current | 01:45, 14 January 2014 | 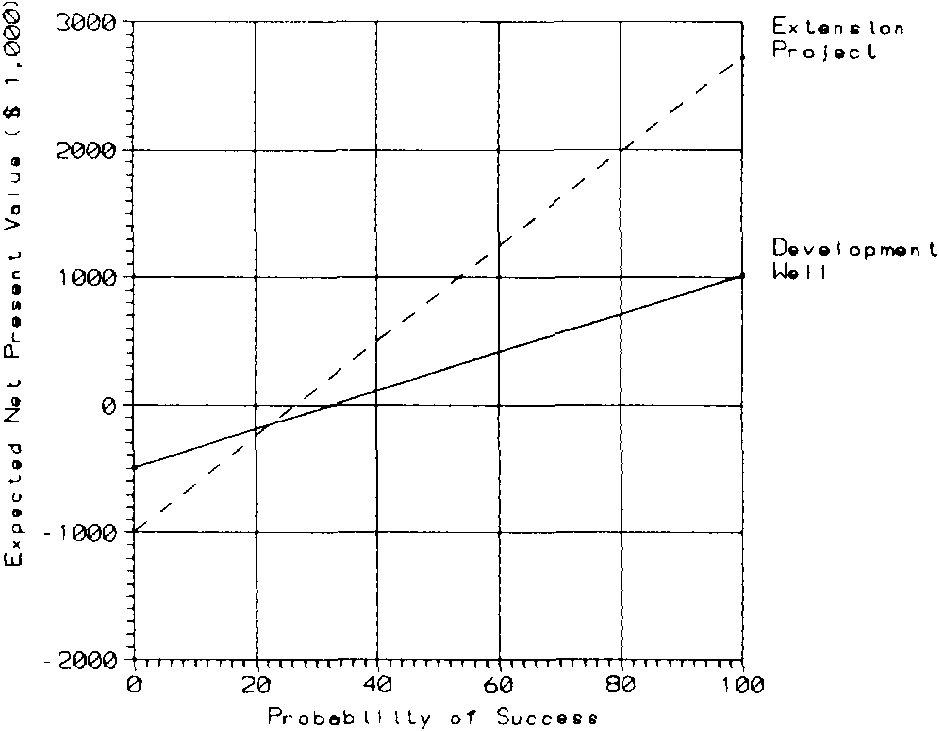 | 939 × 731 (11 KB) | Importer (talk | contribs) | Expected value profile plot. Expected value is plotted versus probability of success example for development well and multiwell extension project. Category:Economics and risk asseement |
You cannot overwrite this file.
File usage
The following page uses this file: