Difference between revisions of "Isochron"
Jump to navigation
Jump to search
FWhitehurst (talk | contribs) m (added Category:Geophysical methods using HotCat) |
Cwhitehurst (talk | contribs) |
||
| Line 16: | Line 16: | ||
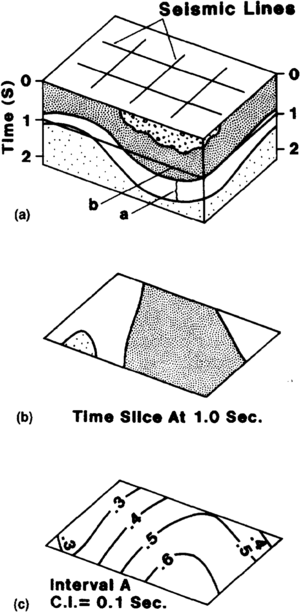
[[file:mapping-with-two-dimensional-seismic-data_fig6.png|thumb|left|300px|{{figure number|1}}(a) Block diagram showing the time that Is mapped for a time slice map. (b) Interval that is mapped on time interval map. (c) Time interval map.]] | [[file:mapping-with-two-dimensional-seismic-data_fig6.png|thumb|left|300px|{{figure number|1}}(a) Block diagram showing the time that Is mapped for a time slice map. (b) Interval that is mapped on time interval map. (c) Time interval map.]] | ||
| − | + | {{clear}} | |
{{stub}} | {{stub}} | ||
[[Category:Geophysical methods]] | [[Category:Geophysical methods]] | ||
Revision as of 18:58, 29 July 2014
| Development Geology Reference Manual | |

| |
| Series | Methods in Exploration |
|---|---|
| Part | Geophysical methods |
| Chapter | Mapping with two-dimensional seismic data |
| Author | I. R. Gordon |
| Link | Web page |
| Store | AAPG Store |
Time interval (or isotime or isochron) maps are commonly used for interpreting changes in thickness between interpreted horizons (Figure 1). To map time intervals, calculate the difference in time (normally two-way time) between two events at each shotpoint and contour the resultant values.
This article is a stub. You can help AAPG Wiki by expanding it.
