Difference between revisions of "Seismic data interpretation - recurring themes"
Cwhitehurst (talk | contribs) (→Edges) |
FWhitehurst (talk | contribs) |
||
| Line 20: | Line 20: | ||
[[file:interpreting-seismic-data_fig12-1.png|thumb|{{figure number|1}}. Copyright: Liner, 1999; courtesy PennWell.]] | [[file:interpreting-seismic-data_fig12-1.png|thumb|{{figure number|1}}. Copyright: Liner, 1999; courtesy PennWell.]] | ||
| − | The knowledge required for working with seismic data is built of several layers like an onion. [[:file:interpreting-seismic-data_fig12-1.png|Figure 1]] illustrates the idea. At the heart of the onion are 1-D seismic concepts like wavelet, convolution, traveltime, and reflection coefficient. All this shows up in the next layer, 2-D seismic, plus arrays, offset, dip, and lateral velocity variation. The next layer, 3-D seismic, includes all of 2-D plus azimuth, bins, and the data volume. Finally, 4-D seismic is time-lapse 3-D, which introduces repeatability, fluid flow, and difference volume. | + | The knowledge required for working with seismic data is built of several layers like an onion. [[:file:interpreting-seismic-data_fig12-1.png|Figure 1]] illustrates the idea. At the heart of the onion are 1-D seismic concepts like [[wavelet]], [[convolution]], [[traveltime]], and [[reflection coefficient]]. All this shows up in the next layer, 2-D seismic, plus [[Seismic array|arrays]], [[offset]], [[dip]], and [[lateral velocity]] variation. The next layer, 3-D seismic, includes all of 2-D plus azimuth, bins, and the data volume. Finally, 4-D seismic is time-lapse 3-D, which introduces repeatability, fluid flow, and difference volume. |
==Data quality== | ==Data quality== | ||
Revision as of 11:29, 1 April 2014
| Exploring for Oil and Gas Traps | |

| |
| Series | Treatise in Petroleum Geology |
|---|---|
| Part | Predicting the occurrence of oil and gas traps |
| Chapter | Interpreting seismic data |
| Author | Christopher L. Liner |
| Link | Web page |
| Store | AAPG Store |
From the broad field of seismology, a few things seem to pop up with regularity. Some of these have been collected here. Keep them in mind when working with seismic data—in particular, 3-D seismic data.
The onion
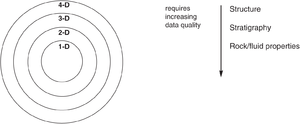
The knowledge required for working with seismic data is built of several layers like an onion. Figure 1 illustrates the idea. At the heart of the onion are 1-D seismic concepts like wavelet, convolution, traveltime, and reflection coefficient. All this shows up in the next layer, 2-D seismic, plus arrays, offset, dip, and lateral velocity variation. The next layer, 3-D seismic, includes all of 2-D plus azimuth, bins, and the data volume. Finally, 4-D seismic is time-lapse 3-D, which introduces repeatability, fluid flow, and difference volume.
Data quality
The main job for seismic interpretation is to map three things:
- Structure
- Stratigraphy
- Rock/fluid properties
In this order, each task requires increasing data quality. Quality is a nebulous term largely determined at acquisition time by correct survey design and execution. Processing generally has less impact on quality but is still very important.
Echo location
The seismic technique is an echo-location method similar to sonar, radar, and medical ultrasound. A wave is emitted, and it rattles around in the material. Part of it is reflected back. From the part that returns, we attempt to determine what is out there.
Traveltimes and amplitudes
In one sense, seismic data consist of traveltime, amplitude, and waveform information. Structure mapping involves only the traveltimes, stratigraphy involves both traveltime and amplitude, and rock/fluid property information lives in the amplitude and waveform.
Edges
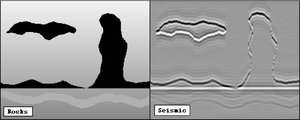
If you look at a rock outcrop, you see sandstone, shale, limestone, etc. If you look at seismic data, you see the edges of rock units. The figure below shows the edge effect on a Gulf of Mexico salt dome example. Seismic is, in effect, an edge detection technique. The bigger the velocity and/or density contrast between the rocks, the stronger the edge.
To be fair, seismic impulses respond to much more than just lithology. Any vertical variation in rock property that modifies the velocity or density can potentially generate seismic reflections, including a fluid contact, porosity variation, or shale density change.
Event tracking
A key part of the interpretation process for 3-D seismic data is event tracking. To picture this, think of the 3-D seismic data volume as a block of vanilla ice cream with chocolate streaks. Tracking means we follow a streak into the cube and find out where it goes—this is structure mapping. We also keep track of how dark the chocolate is as we follow it—this is amplitude mapping.
Computer limitations
Available computer speed and memory impose severe limitations on the use of advanced 3-D seismic processing. Current hardware is sufficient for the interpretation process, but the software can be complicated and expensive (cost::5,000 USD-cost::180,000 USD).
See also
- Phases of a seismic project
- 3-D seismic: the data cube
- Components of a 3-D seismic survey
- 3-D seismic data views

