Difference between revisions of "Seismic interpretation: surface slicing"
Cwhitehurst (talk | contribs) |
Cwhitehurst (talk | contribs) m (added Category:Treatise Handbook 3 using HotCat) |
||
| Line 40: | Line 40: | ||
[[Category:Predicting the occurrence of oil and gas traps]] | [[Category:Predicting the occurrence of oil and gas traps]] | ||
[[Category:Interpreting 3-D seismic data]] | [[Category:Interpreting 3-D seismic data]] | ||
| + | [[Category:Treatise Handbook 3]] | ||
Latest revision as of 19:30, 27 January 2022
| Exploring for Oil and Gas Traps | |

| |
| Series | Treatise in Petroleum Geology |
|---|---|
| Part | Predicting the occurrence of oil and gas traps |
| Chapter | Interpreting 3-D seismic data |
| Author | Geoffrey A. Dorn |
| Link | Web page |
| Store | AAPG Store |
Surface slicing is a novel approach to interpreting seismic horizons. This technique involves visualizing and interpreting areally finite portions of horizons on time slice slabs of the data. The slab thickness is a weak function of the bandwidth of the data and a stronger function of the dip of the reflections. For a detailed description of the technique see Stark.[1]
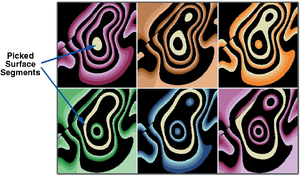
The figures below show the general concept of the technique. Figure 1 is a perspective view of a horizon structure (a) and the same structure split into 12-ms slabs and dissected (b). Suppose Figure 1 represented a reflection (say a peak) in a 3-D survey. This structure could be cut into time slabs and dissected. Figure 2 shows what these time-slice slabs might look like, where within each slab only the peaks are displayed. The dissected portions of the 3-D structure appear as annuli that fit perfectly within each other. Interpreting the horizon consists of selecting those elements that fit together, somewhat like assembling a jigsaw puzzle.


Surface slicing assumptions
For an interpreter who is practiced in surface slice picking and in the appropriate settings of the various parameters that control the algorithm, surface slicing can be an extremely efficient way to interpret horizons. Since entire areas on the horizon are picked with each click of the mouse button, this technique is not very sensitive to the number of traces in the 3-D survey. It assumes local continuity and connectivity in the data, and it assumes a consistent phase is being interpreted. It is less sensitive to discontinuities and poor signal-to-noise ratio than voxel tracking or autotracking because it is not entirely an automatic technique; the interpreter controls the technique and frequently can achieve better results because interpretive judgment can be applied.
See also
References
- ↑ 1.0 1.1 1.2 Stark, T., J., 1996, Surface slice generation and interpretation—a review: The Leading Edge, vol. 15, p. 818–819, DOI: 10.1190/1.1437369.