Search results
Jump to navigation
Jump to search
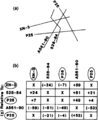
File:Mapping-with-two-dimensional-seismic-data fig3.png ...teral differences in velocity on conversion of time and depth. If a single velocity function of 8300 ft/sec were used, errors of +6 ft at A and -440 ft at B wo(885 × 1,087 (41 KB)) - 19:36, 14 January 2014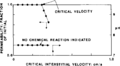
File:Rock-water-reaction-formation-damage fig2.png Critical velocity determination with pH monitoring.(932 × 511 (8 KB)) - 19:18, 14 January 2014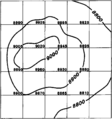
File:Mapping-with-two-dimensional-seismic-data fig5.png Velocity map with velocities marked at grid intersections.(934 × 996 (15 KB)) - 19:36, 14 January 2014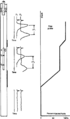
File:Production-logging fig3.png Tracer velocity shot technique and injection profile.(953 × 1,619 (40 KB)) - 16:37, 14 January 2014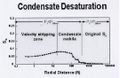
File:AlAhmadiTawfiqFigure5.jpg Condensate Saturation versus Radial Distance from wellbore, with velocity stripping zone (Daungkaew & Gringarten, 2004).(538 × 350 (44 KB)) - 23:03, 9 November 2021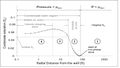
File:AlAhmadiTawfiqFigure7.jpg Condensate saturation profile with condensate drop-out and velocity stripping (Gringarten, Ogunrewo & Uxukbayev, 2011).(775 × 441 (47 KB)) - 23:09, 9 November 2021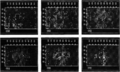
File:Seismic-inversion fig6.png ...he 3-D survey of the river channel zone. The lightly shaded areas show low velocity material in which reservoir sands are present. Copyright: Western Geophysic(2,045 × 1,222 (1.56 MB)) - 19:34, 14 January 2014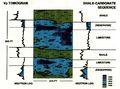
File:Cross-borehole-tomography-in-development-geology fig4.jpg ...the contrast in log curves and the corresponding change in the tomographic velocity fields. (After Justice et al., 1990.). See [[Cross-borehole tomography in d(1,945 × 1,441 (1.35 MB)) - 17:12, 15 January 2014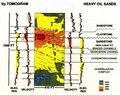
File:Cross-borehole-tomography-in-development-geology fig5.jpg ...stratigraphic units and fluid saturation zones correlate with tomographic velocity fields and provide the basis for interpretation of reservoir and fluid prop(2,000 × 1,591 (1.16 MB)) - 17:12, 15 January 2014


