Phanerozoic Tethys region
| Petroleum systems of the Tethyan region | |

| |
| Series | AAPG Memoir |
|---|---|
| Chapter | The evolution of the Tethys region throughout the Phanerozoic: A brief tectonic reconstruction |
| Author | Fabrizio Berra, Lucia Angiolini |
| Link | Web page |
| Store | AAPG Store |
The Tethyan region is a major petroleum province. The paleogeographic position and tectonic history is a major control on sedimentation across the region, and this has influenced the sequestration of hydrocarbons in the region. The North African-Arabian plate evolved along the Tethyan margins (Proto-Tethys, Paleo-Tethys, Neo-Tethys) from Pre-Cambrian to Recent.
Paleogeographic reconstructions
Paleogeographic maps have been reconstructed for selected time intervals: Cambrian, Late Ordovician, Early Devonian, Early Permian, Permian-Triassic boundary, Norian, Callovian, Aptian, Cretaceous-Cenozoic boundary, and Late Eocene. For each time interval both the general picture of the major plate tectonic configuration and a detail of the paleogeography and paleoenvironment of North Africa to the Middle East are presented. On these maps, the major paleoenvironmental settings (from continental to shallow marine and deep ocean) are shown for the area stretching from North Africa to Afghanistan in all the selected time slices. Besides the major tectonic events, the global climate evolution and their interplay are discussed, which in some cases led to significant biotic turnovers or even to mass extinctions (e.g., Late Ordovician, Permian-Triassic boundary, Cretaceous-Cenozoic boundary). Paleogeographic maps have been compiled from literature, selecting those based on sound paleomagnetic/paleobiogeographic data. Each map is accompanied by the description of the major tectonic events that characterized the considered time interval. When contrasting paleogeographic reconstructions were available, their differences have been discussed. In general, major differences concern the interpretation of the setting and positioning of the microplates and terranes between the major continental plates.

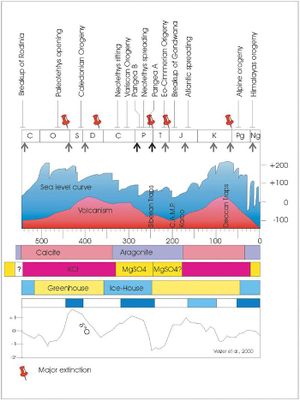
The paleogeography of the Earth during the Phanerozoic reflects the breakup of Rodinia and the formation of Pangea and its later breakup. Sedimentation was affected by the latitudinal position of the continents, the global climate conditions, and the seawater chemistry at the largest scale, and at the basin scale by the gradual changes in the local tectonic environment that accompanied the formation and destruction of the Tethyan oceans. Each global map is coupled with a more detailed map of North Africa and the Middle East. On these maps, the major depositional settings (emerged land, continental, shallow marine, and deep marine environments) are shown. These maps are a simplified view of the Western Tethys region, whereas the detailed facies distribution of the major domains is described in the chapters that follow in this book. The time-position of these paleogeographic maps is framed by the Phanerozoic history, so each map is viewed in the context of the evolution of the sea-water chemistry (aragonite vs. calcite sea, KCl vs. MgO4 evaporites), the global sea-level curve, the major volcanic events, the global climate, the major geodynamic events, and the age of the five major extinctions of the Phanerozoic (Figure 1). The interplay between these changing parameters is important as it controls and explains the distribution of climate belts (and thus the distribution of the climate-sensitive depositional environments), the depth and area of the submerged shelves, and the biogenic contribution to sediment production.