Search results
Jump to navigation
Jump to search
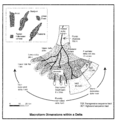
File:M91FG123.png ...and tidal-dominated, respectively. The delta and its divisions are not to scale (from Reynolds, 1999). Reprinted with permission from the AAPG. From Shephe(2,064 × 2,095 (121 KB)) - 19:40, 13 August 2015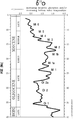
File:Applied-paleontology fig17-29.png ...pyright|Wright and Miller, 1993; courtesy American Geophysical Union. Time scale adapted from Berggren et al., 1985a, <xref ref-type="bibr" rid="ch17r13">b} ...yright: Wright and Miller, 1993; courtesy American Geophysical Union. Time scale adapted from Berggren et al., 1985a, <xref ref-type="bibr" rid="ch17r13">b.(773 × 1,259 (209 KB)) - 16:03, 18 January 2014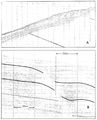
File:M31F25.jpg ...e of the fault. Horizontal scale is 300 m between shot points and vertical scale is 10 milliseconds per time line, or 7.6 m (25 ft). Coleman, J. M., and D.(1,087 × 1,348 (940 KB)) - 18:21, 18 August 2014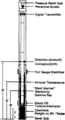
File:Measurement-while-drilling fig1.png Location of MWD hardware (not drawn to scale). (From Anadrill, 1988.)(854 × 1,577 (62 KB)) - 01:22, 14 January 2014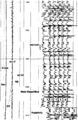
File:Dipmeters fig2.png Expanded scale recording of raw dipmeter data from a six-arm tool.(952 × 1,469 (45 KB)) - 01:19, 14 January 2014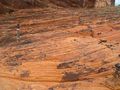
File:Botucatu 1.jpg Large-scale of cross strata structure in the Botucatu Formation in Uruguay(2,592 × 1,944 (1.48 MB)) - 15:53, 24 June 2015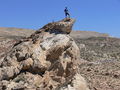
File:Challaco fluvial deposits - zeesstof via flickr.jpg Challaco fluvial deposits with Deutchlander for scale. Taken by zeesstof (http://bit.ly/1s8fRuH) on Flickr. CC-BY-ND 2.0(3,264 × 2,448 (1.93 MB)) - 20:43, 31 July 2014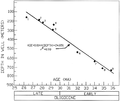
File:Applied-paleontology fig17-32.png Printed with permission of Unocal; time scale after Berggren et al., 1985a.(1,343 × 1,127 (254 KB)) - 16:06, 18 January 2014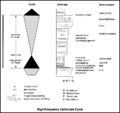
File:M91FG197.JPG High-frequency carbonate cycle on a meter scale from the Mississippian Madison Formation in the Wind River Basin of Wyoming(800 × 755 (66 KB)) - 13:09, 20 August 2015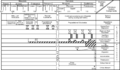
File:Sedimentary-basin-analysis fig4-45.png Time scale from Haq et al. (1988); DOW represents source rock, generation, and critica(1,995 × 1,163 (98 KB)) - 19:53, 30 January 2014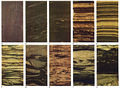
File:M31F18.jpg ...mouth bar sands. The dark material is transported organic debris. I. Large-scale cross laminations common near the top part of the distributary-mouth bar de(1,349 × 994 (1.86 MB)) - 18:16, 18 August 2014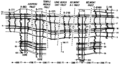
File:Geological-cross-sections fig2.png ...Wilmington anticline in the Long Beach unit showing log displays. Distance scale is irregular to make the cross section more compact. The left track of each(1,921 × 1,041 (171 KB)) - 15:32, 14 January 2014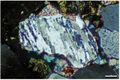
File:M109CH01Polychristalline.jpg ...rystals. In addition, crystal boundaries are diffuse. XPL, AFeS, KFS, BDI, Scale bar = 0.07 mm. From From AAPG Memoir 109—A Color Guide to the Petrography(655 × 438 (71 KB)) - 20:07, 23 January 2019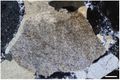
File:M109CH01Monocrystalline.jpg ...(cement) around the upper part of the grain has far fewer inclusions. XPL, Scale bar = 0.26 mm. From From AAPG Memoir 109—A Color Guide to the Petrography(656 × 439 (87 KB)) - 20:20, 23 January 2019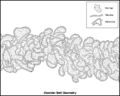
File:M91FG174.JPG ...x labyrinth of point bars and clay plugs. The meander belt width is on the scale of a few hundreds of meters. Reprinted with permission from, and ©: by,(800 × 639 (117 KB)) - 16:13, 31 July 2015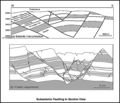
File:M91Ch13FG92.JPG ...eformed by plane strain extension. The plaster model shows that many small-scale faults are expected to exist in the Gullfaks structure but are below seismi(600 × 517 (60 KB)) - 21:40, 29 April 2015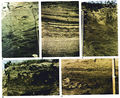
File:M31F5.jpg ...in a meander point bar. A. Cyclic flood deposits in a point bar. B. Small-scale cross-stratification and organic debris. C. Climbing ripple sequence capped(1,152 × 941 (941 KB)) - 19:33, 15 August 2014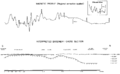
File:Magnetics fig1.png ...develops fully to the north, and minor sharp anomalies (shown on expanded scale) indicate dikes and sills within the sediments.(2,677 × 1,649 (34 KB)) - 23:17, 14 January 2014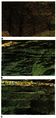
File:M31F2.jpg Photographs of bedding in a braided channel deposit. A. Large-scale cross-bedding in the lower part of a fining-upward cycle on a braided chann(365 × 772 (175 KB)) - 18:56, 15 August 2014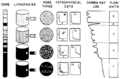
File:Flow-units-for-reservoir-characterization fig1.png ...ow units and probable permeability barriers that can be mapped at the same scale as reservoir quality flow units.(1,487 × 976 (91 KB)) - 23:13, 14 January 2014


