Search results
Jump to navigation
Jump to search
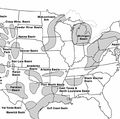
File:MainPageBasinCenteredGasFig13.jpg Main Page image for the Basin centered gas: global distribution article(404 × 400 (63 KB)) - 19:33, 13 July 2015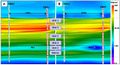
File:AlsaudKatterbauerFigure5.jpg – Time lapse EM resistivity image between OBS1 and OBS2. (A) before water injection (B) After four months of(624 × 338 (79 KB)) - 22:14, 3 February 2022
File:Sandstone banner.jpg Excerpted from original image by Flickr user The Booklight; licensed CC-BY. [http://www.flickr.com/photos(1,200 × 300 (197 KB)) - 22:19, 17 January 2014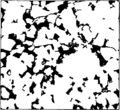
File:Reservoir-quality fig1.png Binary petrographic image of sandstone. Dark areas are pores and light areas are grains or cement.(950 × 868 (20 KB)) - 18:46, 14 January 2014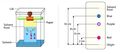
File:AlotaibiFigure5.jpg Paper chromatography. Image Source: Ebere, E.C., Obinna, I.B., and Wirnkor, V.A.(November 2019). Applic(936 × 422 (52 KB)) - 21:24, 3 February 2022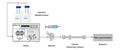
File:AlotaibiFigure4.jpg Liquid chromatography system. Image Source: César Aquiles Lázaro de la Torre1, Juan Espinoza Blanco, Joab Tra(936 × 392 (39 KB)) - 21:23, 3 February 2022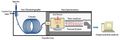
File:AlotaibiFigure3.jpg A typical GC/MS system. Image source: Abdul-Hamid M. Emwas, Zeyad A. Al-Talla, Yang Yang, and Najeh M. Kh(936 × 310 (48 KB)) - 21:23, 3 February 2022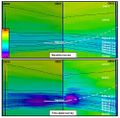
File:AlsaudKatterbauerFigure6.jpg Unit 3,4, and 5 time-lapse cross-sectional EM resistivity image of the observers and injector (Baseline) before water injection (Time lapse(500 × 492 (77 KB)) - 22:14, 3 February 2022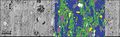
File:Figure-8.jpg A secondary electron image of a shale sample with an EDS-derived mineral segmentation overlay. In the(1,353 × 418 (106 KB)) - 17:34, 15 August 2014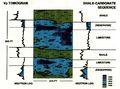
File:Cross-borehole-tomography-in-development-geology fig4.jpg Single image tomograms documenting stratigraphy and reservoir zones. Heterogeneity of th(1,945 × 1,441 (1.35 MB)) - 17:12, 15 January 2014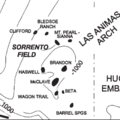
File:MainPageSorrentoField.png Main Page image for Setting and structure of the Sorrento field article. Could also be util(400 × 400 (43 KB)) - 17:53, 5 January 2015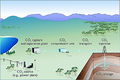
File:GeosequestrationProcess.JPG A simplified view of the steps involved in the geosequestration process (image courtesy of Cooperative Research Centre for Greenhouse Gas Technologies [CO(600 × 399 (131 KB)) - 15:54, 7 August 2014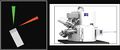
File:Figure-9.jpg ...the sample at a time, while the electron beam/detector system captures an image of each newly exposed surface. At right, a picture of a commercial FIB-SEM(982 × 410 (22 KB)) - 17:35, 15 August 2014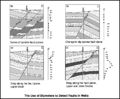
File:M91Ch13FG80.JPG Dipmeter or image data can be used to pick likely fault planes in wells. Changes in dip ampli(800 × 660 (102 KB)) - 21:14, 29 April 2015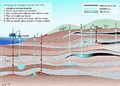
File:CO2StorageOptions.JPG Options for the geological storage of CO2 (image courtesy of Cooperative Research Centre for Greenhouse Gas Technologies [CO(800 × 570 (244 KB)) - 17:26, 7 August 2014
File:NileDelta.jpg ...n this enhanced true colour Medium Resolution Imaging Spectrometer (MERIS) image. The grey area to the bottom of the "triangle" of the delta is Egypt's Capi(689 × 700 (161 KB)) - 18:06, 15 August 2014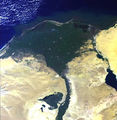
File:MainPageNileDelta.jpg ...n this enhanced true colour Medium Resolution Imaging Spectrometer (MERIS) image. The grey area to the bottom of the "triangle" of the delta is Egypt's Capi(390 × 400 (166 KB)) - 19:55, 6 April 2015


