File:Using-magnetics-in-petroleum-exploration fig14-9.png
Original file (1,107 × 786 pixels, file size: 319 KB, MIME type: image/png)
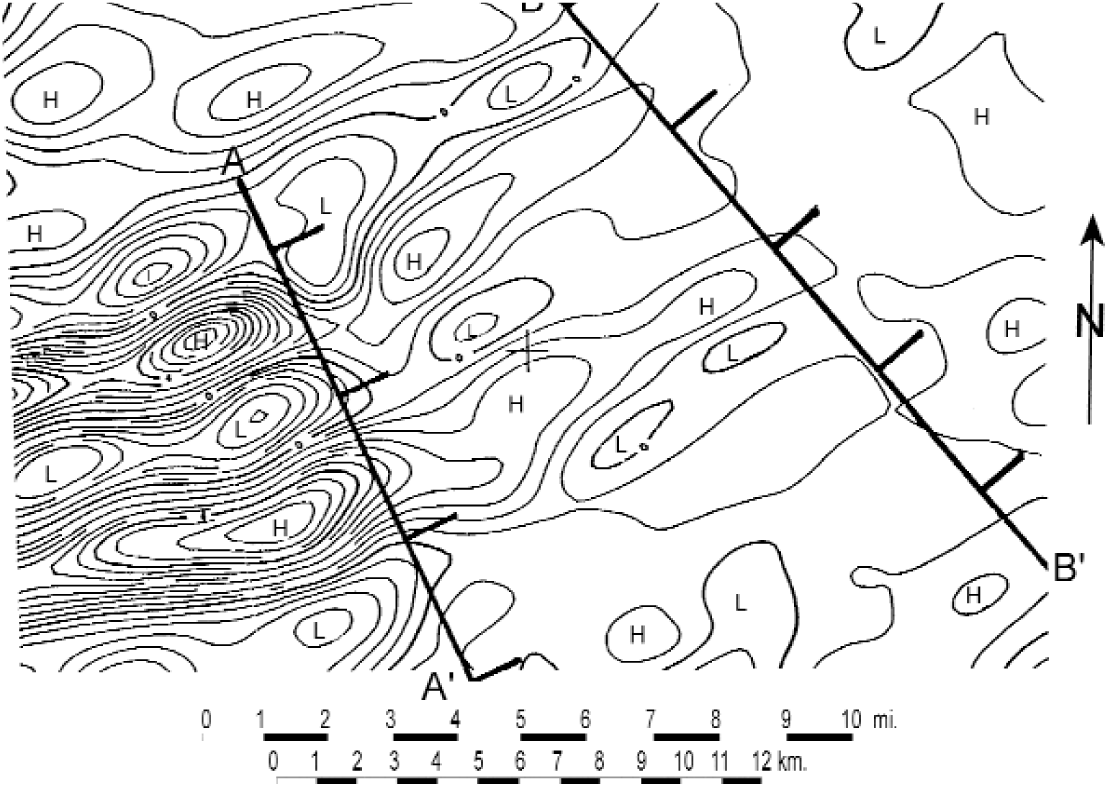
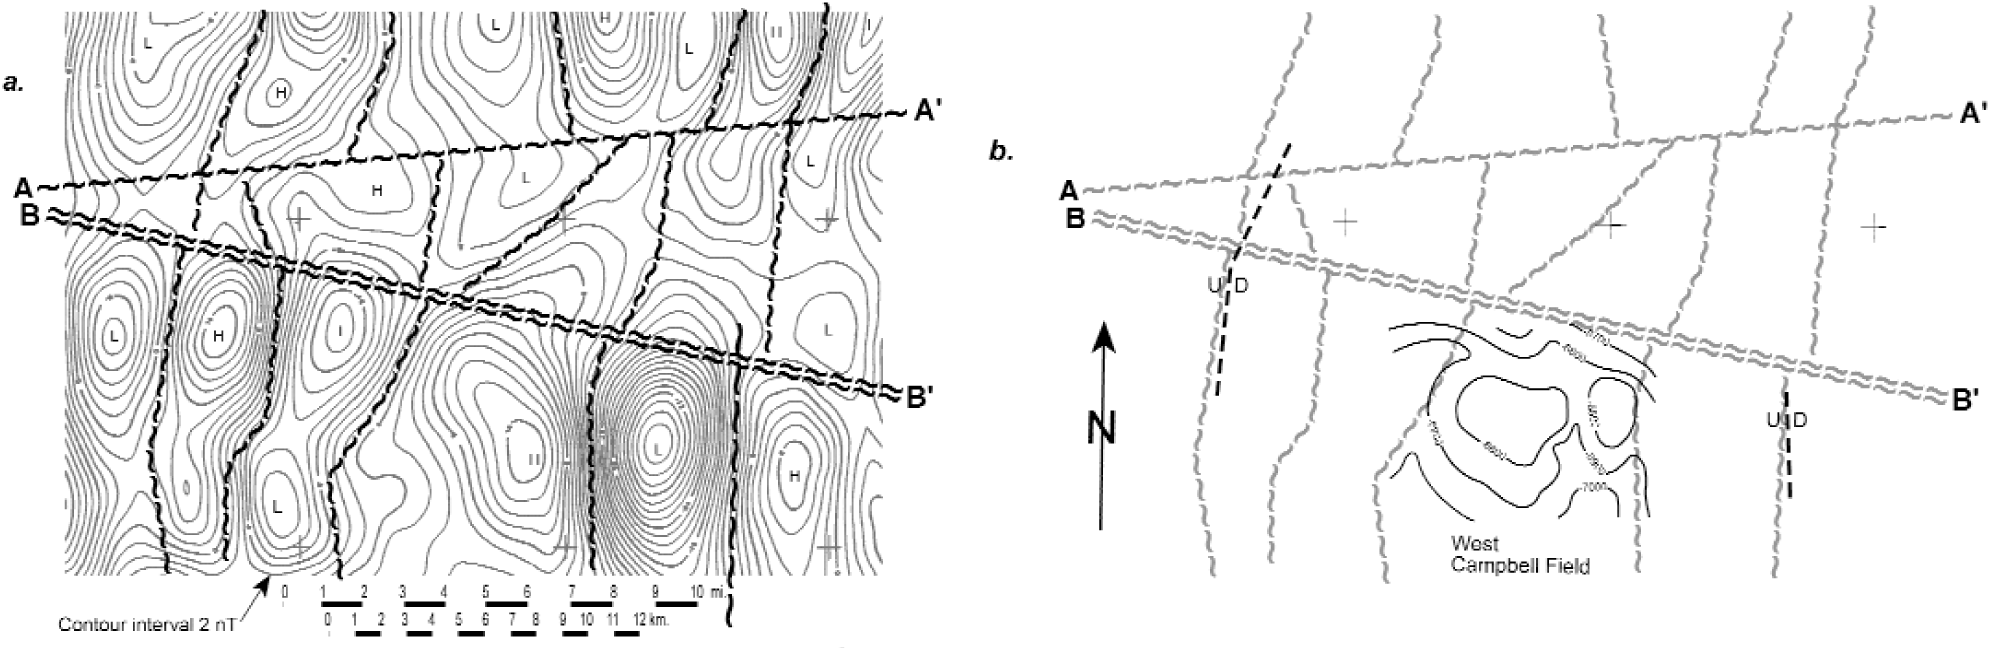
The figure below shows a residual aeromagnetic map of an area on the north shelf of the Anadarko basin in Oklahoma where the sedimentary section is approximately 3.6 km (12,000 ft) thick and basement lies about 3.8 km (12,500 ft) beneath flight level. The residual magnetic contours (a) are shown at a 2-nT interval. The interpreted shear zones are traced along the linear gradients separating the residual magnetic highs and lows and along truncation lines of anomalies. On the right figure (b), two faults located from subsurface mapping are shown, labeled U/D. The evidence for their existence is seen in subsurface mapping. Both are located exactly along the interpreted basement shear zones, or block boundaries, as represented by gradients on the magnetic map. Note, however, that most of the interpreted basement shear zones in this area have no corresponding overlying faults. These zones were never reactivated—at least not sufficiently enough to be detected by the existing subsurface data.
File history
Click on a date/time to view the file as it appeared at that time.
| Date/Time | Thumbnail | Dimensions | User | Comment | |
|---|---|---|---|---|---|
| current | 22:24, 17 January 2014 | | 1,107 × 786 (319 KB) | Matt (talk | contribs) | Category:Predicting the occurrence of oil and gas traps |
| 21:28, 17 January 2014 | 1,990 × 650 (531 KB) | Importer (talk | contribs) | The figure below shows a residual aeromagnetic map of an area on the north shelf of the Anadarko basin in Oklahoma where the sedimentary section is approximately 3.6 km (12,000 ft) thick and basement lies about 3.8 km (12,500 ft) beneath flight level. ... |
You cannot overwrite this file.
File usage
The following page uses this file: