Difference between revisions of "3-D seismic data views"
(Initial import) |
Cwhitehurst (talk | contribs) |
||
| Line 18: | Line 18: | ||
As it arrives on tape from the processor, 3-D seismic data are organized into lines composed of traces. In the computer these are all merged into a dense cube of data. The data cube can be sectioned, or sliced, in several ways. Vertical cuts through the data cube are called '''lines''' or '''sections'''. For marine surveys, in-line is the direction of boat movement (parallel to receivers) and cross-line is perpendicular to boat movement. For land surveys, there is no uniform definition of in-line and cross-line. A vertical section that is neither inline nor cross-line is an arbitrary line and may be very irregular in map view as needed to pass through locations of interest. | As it arrives on tape from the processor, 3-D seismic data are organized into lines composed of traces. In the computer these are all merged into a dense cube of data. The data cube can be sectioned, or sliced, in several ways. Vertical cuts through the data cube are called '''lines''' or '''sections'''. For marine surveys, in-line is the direction of boat movement (parallel to receivers) and cross-line is perpendicular to boat movement. For land surveys, there is no uniform definition of in-line and cross-line. A vertical section that is neither inline nor cross-line is an arbitrary line and may be very irregular in map view as needed to pass through locations of interest. | ||
| − | + | [[:file:interpreting-seismic-data_fig12-5.png|Figure 1]] shows how the vertical slices are labeled, depending on their orientation. | |
| − | [[file:interpreting-seismic-data_fig12-5.png|thumb|{{figure number| | + | [[file:interpreting-seismic-data_fig12-5.png|thumb|{{figure number|1}}. Copyright: Liner, 1999; courtesy PennWell.]] |
==Horizontal slices== | ==Horizontal slices== | ||
| − | Horizontal or subhorizontal cuts through a seismic data cube are called slices. As illustrated in | + | Horizontal or subhorizontal cuts through a seismic data cube are called slices. As illustrated in [[:file:interpreting-seismic-data_fig12-5.png|Figure 1]], horizontal slices can be |
* Time slices (horizontal cuts of a time cube) | * Time slices (horizontal cuts of a time cube) | ||
Revision as of 20:53, 21 January 2014
| Exploring for Oil and Gas Traps | |

| |
| Series | Treatise in Petroleum Geology |
|---|---|
| Part | Predicting the occurrence of oil and gas traps |
| Chapter | Interpreting seismic data |
| Author | Christopher L. Liner |
| Link | Web page |
| Store | AAPG Store |
Vertical slices
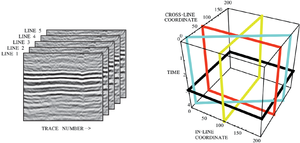
As it arrives on tape from the processor, 3-D seismic data are organized into lines composed of traces. In the computer these are all merged into a dense cube of data. The data cube can be sectioned, or sliced, in several ways. Vertical cuts through the data cube are called lines or sections. For marine surveys, in-line is the direction of boat movement (parallel to receivers) and cross-line is perpendicular to boat movement. For land surveys, there is no uniform definition of in-line and cross-line. A vertical section that is neither inline nor cross-line is an arbitrary line and may be very irregular in map view as needed to pass through locations of interest.
Figure 1 shows how the vertical slices are labeled, depending on their orientation.
Horizontal slices
Horizontal or subhorizontal cuts through a seismic data cube are called slices. As illustrated in Figure 1, horizontal slices can be
- Time slices (horizontal cuts of a time cube)
- Depth slices (horizontal cuts of a depth cube)
- Horizon slices (from tracking)
- Fault slices
Depth slices are only available if the data delivered from the processor are converted to depth. Fault slices require very high-quality data with clear, mappable fault surfaces. Both are rarely encountered.
See also
- Phases of a seismic project
- Recurring themes
- 3-D seismic: the data cube
- Components of a 3-D seismic survey
