File:Evaluating-fractured-reservoirs fig1.png
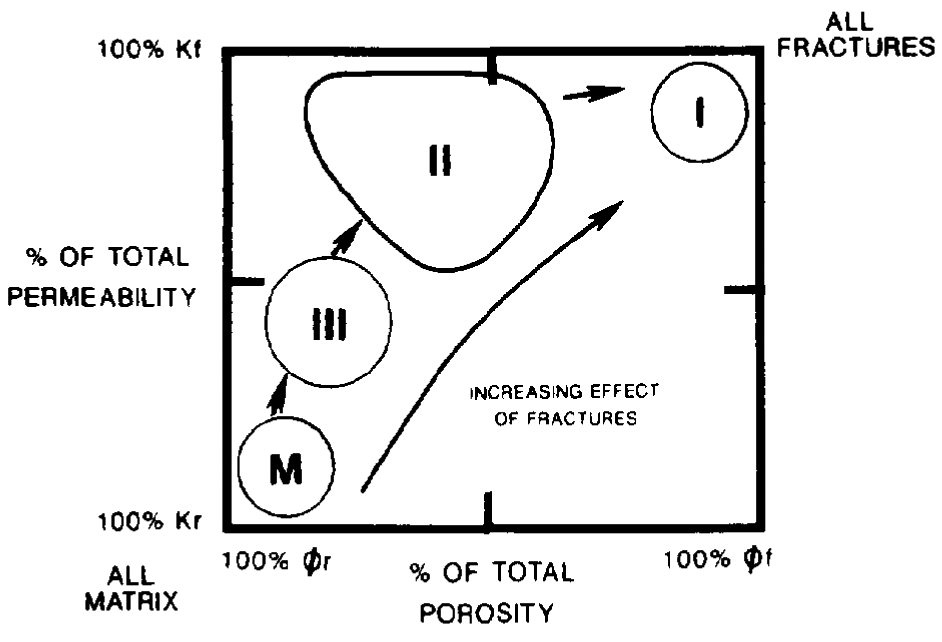
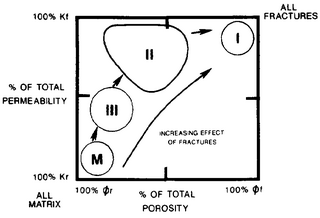
Revision as of 15:00, 14 January 2014 by Importer (talk | contribs) (Crosspiot showing the relative positions of fractured reservoir types 1 through 3 and normal matrix reservoirs (<italic>m</italic>) in the percentage of porosity and permeability space. Symbols: <italic>k</italic><sub><italic>f</italic></sub> = fractur...)
Size of this preview: 800 × 545 pixels. Other resolutions: 320 × 218 pixels | 942 × 642 pixels.
Original file (942 × 642 pixels, file size: 23 KB, MIME type: image/png)
Crosspiot showing the relative positions of fractured reservoir types 1 through 3 and normal matrix reservoirs (<italic>m</italic>) in the percentage of porosity and permeability space. Symbols: <italic>k</italic><italic>f</italic> = fracture permeability, ϕ<italic>f</italic>= fracture porosity, <italic>k</italic><italic>r</italic>= matrix permeability, ϕ<italic>r</italic>= matrix porosity.
File history
Click on a date/time to view the file as it appeared at that time.
| Date/Time | Thumbnail | Dimensions | User | Comment | |
|---|---|---|---|---|---|
| current | 15:00, 14 January 2014 | | 942 × 642 (23 KB) | Importer (talk | contribs) | Crosspiot showing the relative positions of fractured reservoir types 1 through 3 and normal matrix reservoirs (<italic>m</italic>) in the percentage of porosity and permeability space. Symbols: <italic>k</italic><sub><italic>f</italic></sub> = fractur... |
You cannot overwrite this file.
File usage
The following page uses this file: