File:Log-analysis-applications fig2.png
Revision as of 16:36, 14 January 2014 by Importer (talk | contribs) (Interactive spontaneous potential (SP) baseline flattening. The user selects points on the raw SP curve, which represent zero deflection (that is, baseline = 100% shale). By projecting the baseline between two consecutive points, SP deflections are cal...)
Size of this preview: 573 × 600 pixels. Other resolutions: 229 × 240 pixels | 939 × 983 pixels.
Original file (939 × 983 pixels, file size: 9 KB, MIME type: image/png)
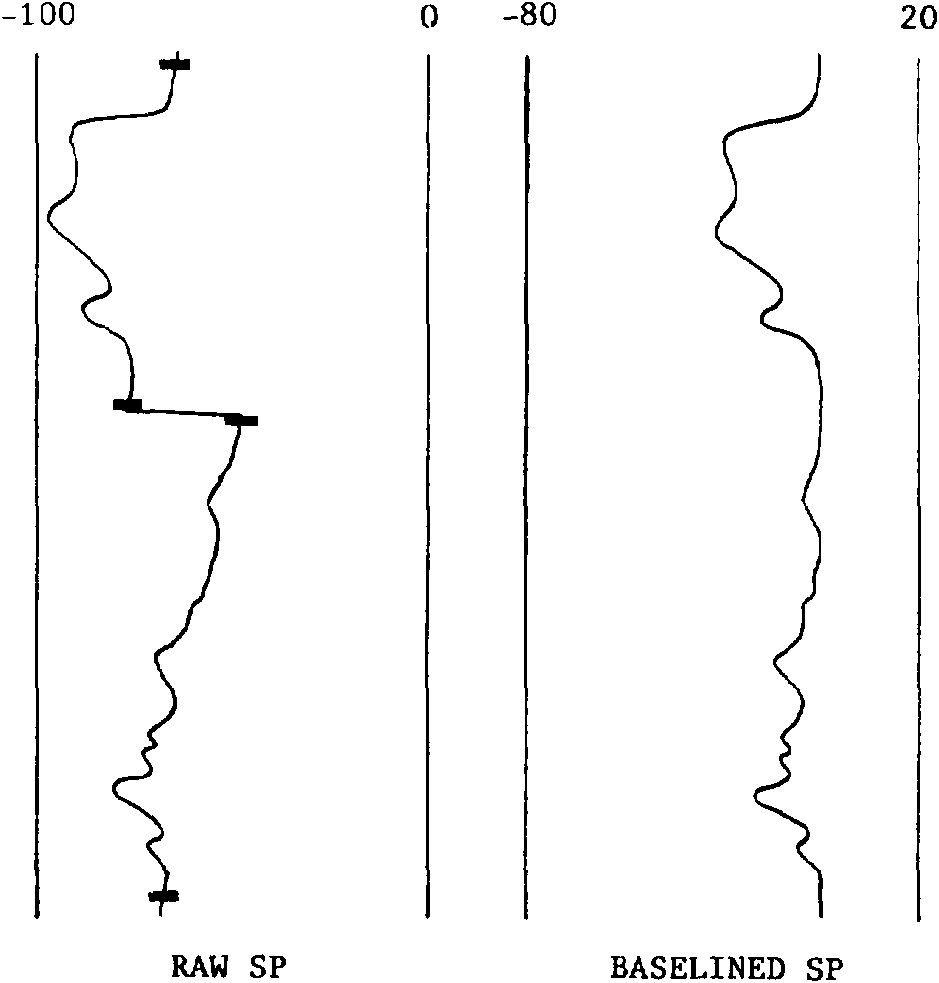
Interactive spontaneous potential (SP) baseline flattening. The user selects points on the raw SP curve, which represent zero deflection (that is, baseline = 100% shale). By projecting the baseline between two consecutive points, SP deflections are calculated and redisplayed as a baselined (or “static”) SP.
File history
Click on a date/time to view the file as it appeared at that time.
| Date/Time | Thumbnail | Dimensions | User | Comment | |
|---|---|---|---|---|---|
| current | 16:36, 14 January 2014 | | 939 × 983 (9 KB) | Importer (talk | contribs) | Interactive spontaneous potential (SP) baseline flattening. The user selects points on the raw SP curve, which represent zero deflection (that is, baseline = 100% shale). By projecting the baseline between two consecutive points, SP deflections are cal... |
You cannot overwrite this file.
File usage
The following page uses this file: