File:M102Ch1Fg7.jpg
Jump to navigation
Jump to search
Size of this preview: 800 × 453 pixels. Other resolutions: 320 × 181 pixels | 1,492 × 845 pixels.
Original file (1,492 × 845 pixels, file size: 1.24 MB, MIME type: image/jpeg)
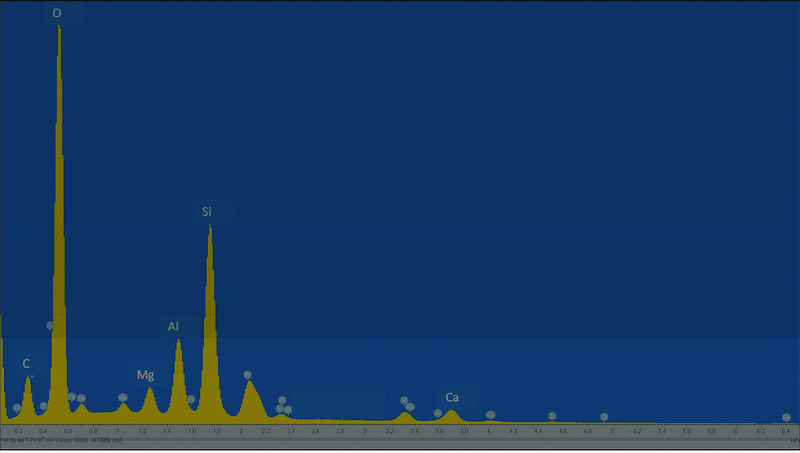
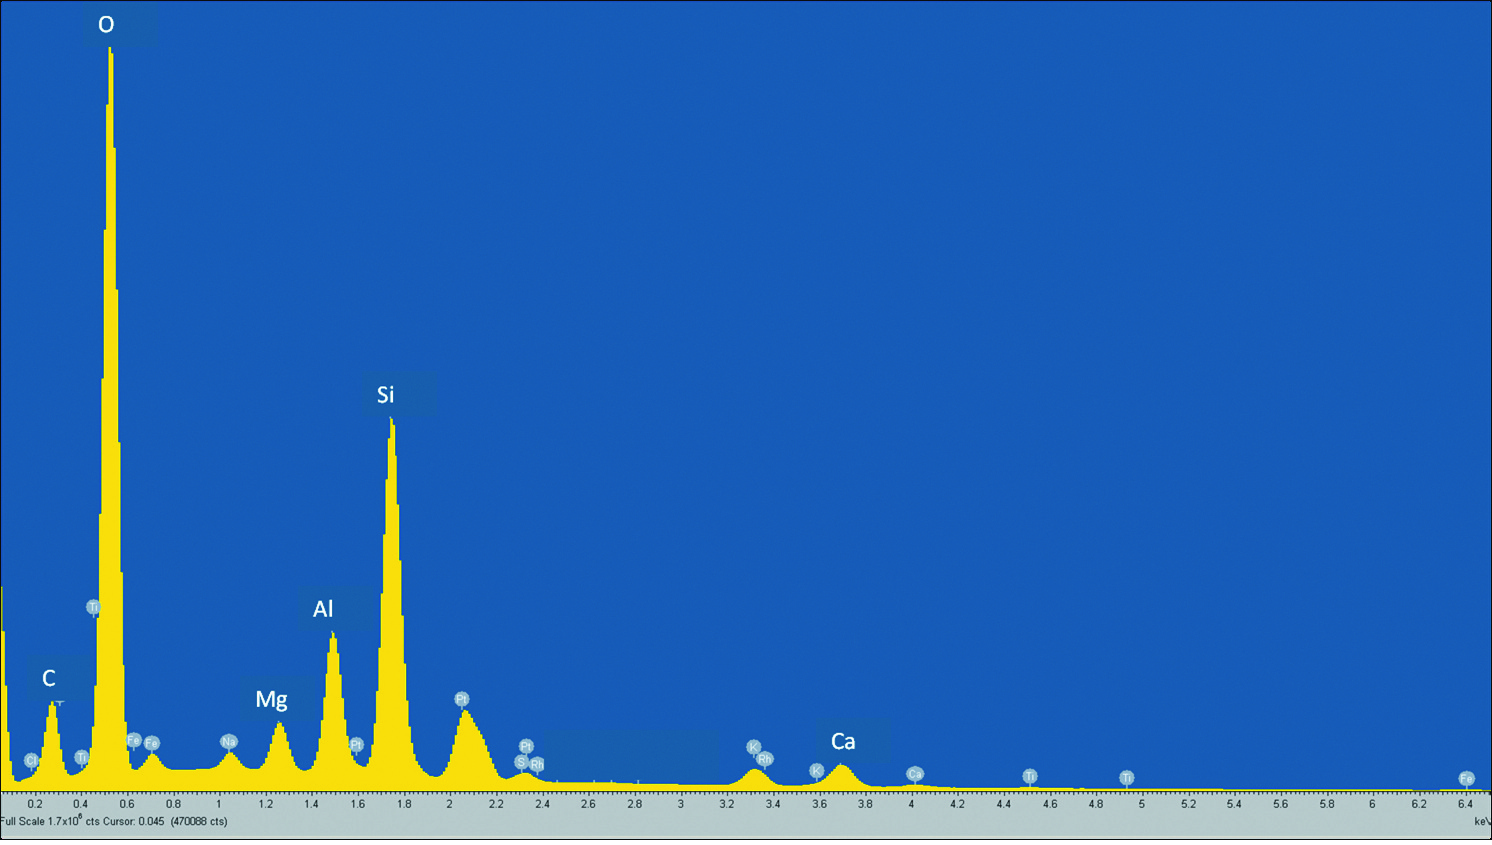
An example of an x-ray spectrum acquired from a shale sample. Individual peaks indicate an elevated concentration of a given element. C=carbon, O=oxygen, Mg=magnesium, Al=aluminum, Si=silicon, Ca=calcium. From AAPG Memoir 102, Chapter 1, Huang et al., 2013, DOI: 10.1306/13391699M1023580.
File history
Click on a date/time to view the file as it appeared at that time.
| Date/Time | Thumbnail | Dimensions | User | Comment | |
|---|---|---|---|---|---|
| current | 22:24, 14 August 2014 | | 1,492 × 845 (1.24 MB) | Molyneux (talk | contribs) | An example of an x-ray spectrum acquired from a shale sample. Individual peaks indicate an elevated concentration of a given element. C=carbon, O=oxygen, Mg=magnesium, Al=aluminum, Si=silicon, Ca=calcium. From AAPG Memoir 102, Chapter 1, Huang et al., ... |
You cannot overwrite this file.
File usage
The following page uses this file: