File:Mapping-with-two-dimensional-seismic-data fig1.png
Jump to navigation
Jump to search

Size of this preview: 757 × 600 pixels. Other resolutions: 303 × 240 pixels | 945 × 749 pixels.
Original file (945 × 749 pixels, file size: 19 KB, MIME type: image/png)
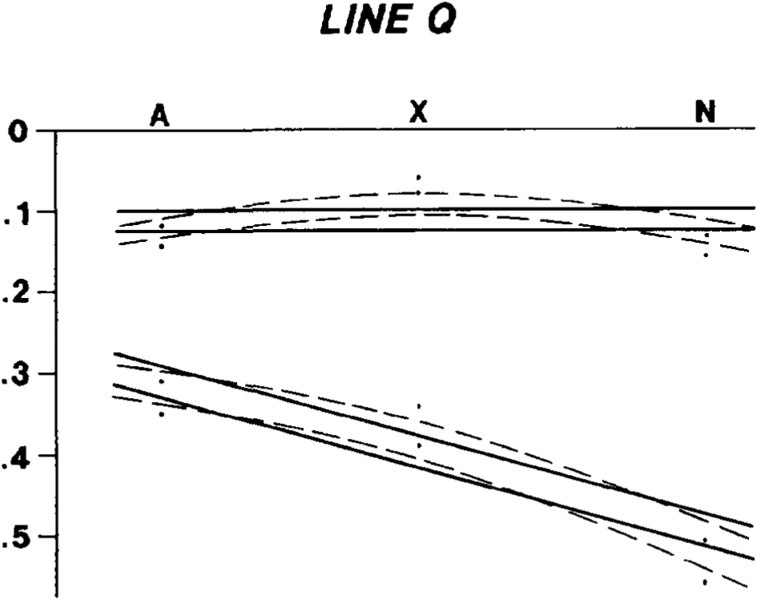
False structure (dashed lines) created when misties are averaged. Dots show times of events on seismic lines A, X, and N where those lines intersect line Q. Solid lines show true attitude of beds. If dashed events were mapped, false structure would appear.
File history
Click on a date/time to view the file as it appeared at that time.
| Date/Time | Thumbnail | Dimensions | User | Comment | |
|---|---|---|---|---|---|
| current | 19:36, 14 January 2014 | | 945 × 749 (19 KB) | Importer (talk | contribs) | False structure (dashed lines) created when misties are averaged. Dots show times of events on seismic lines A, X, and N where those lines intersect line Q. Solid lines show true attitude of beds. If dashed events were mapped, false structure would app... |
You cannot overwrite this file.
File usage
The following page uses this file: