File:Oil-and-condensate-analysis fig6.png
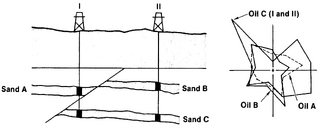
Revision as of 17:17, 14 January 2014 by Importer (talk | contribs) (Gas chromatographic data can be used to determine oil reservoir continuity in conjunction with other methods such as pressure-depth plots. Diagram on right shows a graphical comparison of chromatographic data. Category:Laboratory methods)

Size of this preview: 800 × 318 pixels. Other resolutions: 320 × 127 pixels | 1,915 × 761 pixels.
Original file (1,915 × 761 pixels, file size: 52 KB, MIME type: image/png)
Gas chromatographic data can be used to determine oil reservoir continuity in conjunction with other methods such as pressure-depth plots. Diagram on right shows a graphical comparison of chromatographic data.
File history
Click on a date/time to view the file as it appeared at that time.
| Date/Time | Thumbnail | Dimensions | User | Comment | |
|---|---|---|---|---|---|
| current | 17:17, 14 January 2014 | 1,915 × 761 (52 KB) | Importer (talk | contribs) | Gas chromatographic data can be used to determine oil reservoir continuity in conjunction with other methods such as pressure-depth plots. Diagram on right shows a graphical comparison of chromatographic data. Category:Laboratory methods |
You cannot overwrite this file.
File usage
The following page uses this file: