Difference between revisions of "Geologic mapping (UGM)"
Cwhitehurst (talk | contribs) |
Cwhitehurst (talk | contribs) |
||
| Line 79: | Line 79: | ||
To determine the litology that may compose each litological unit can be used several indicators, such as: | To determine the litology that may compose each litological unit can be used several indicators, such as: | ||
* Different kind of vegetations, vegetation sometimes represents the difference of litology. For example teak trees usually grow above carbonate rocks. Although not usually true, but the data is quite useful as a first approximation. | * Different kind of vegetations, vegetation sometimes represents the difference of litology. For example teak trees usually grow above carbonate rocks. Although not usually true, but the data is quite useful as a first approximation. | ||
| − | * Roughness and fineness of the [[contour]] line patterns, contour line pattern may also indicate differences in litology. Dense contour line pattern indicates solid and hard rock such as metamorphic rocks, [[igneous rock]]s and sedimentary rocks that are resistant while the smooth contour line pattern indicates sedimentary rocks that are not resistant (e.g. mudstone). | + | * Roughness and fineness of the [[contour]] line patterns, contour line pattern may also indicate differences in litology. Dense contour line pattern indicates solid and hard rock such as metamorphic rocks, [[igneous rock]]s and sedimentary rocks that are resistant while the smooth contour line pattern indicates sedimentary rocks that are not resistant (e.g. [[mudstone]]). |
In the tentative geological map we can also draw a lineament that estimate the geological structures such as faults. Fault is marked by the change of contour line patterns drastically or shifted in a narrow area. Estimated geological structure will facilitate observations in the field to look for evidence of the structure. | In the tentative geological map we can also draw a lineament that estimate the geological structures such as faults. Fault is marked by the change of contour line patterns drastically or shifted in a narrow area. Estimated geological structure will facilitate observations in the field to look for evidence of the structure. | ||
Latest revision as of 15:34, 15 January 2024
| Wiki Write-Off Entry | |
|---|---|

| |
| Student Chapter | Universitas Gadjah Mada |
| Competition | June 2015 |
Geological interpretation is one of the critical works in the geological field. To get a geological interpretation that’s closer to the truth, we need adequate data and important geological data packaging. Geological mapping is one geological data presentation that’s most competent and is used for various purposes either for science or exploration of natural resources. A geological map is a map that consists of geological information of the outer layer of earth crust; they are a variation of lithology, distribution of geologic structure, stratigraphy and geomorphology. All of that information read by symbols and colors. Details of geological map depend on the its scale, and the density and accuracy of observations in the field. The final result from all geological methods is a geological map.
Geological mapping
To make a good geological map, a geologist must have skill in geological mapping and know about how to read geological map. Basic steps of geological mapping consist of observation and measurement in the field, taking samples, and analyzing samples in a laboratory. Geological mapping is a multidisciplinary method that combines petrology, structural geology, geomorphology, paleontology, stratigraphy, sedimentology, etc. Geological mapping consists of two kind based on selection trajectory:
- Systematic mapping is done by mapping technically only, without considering geomorphology, distribution of geomorphology, or geological structure pattern. While smart mapping is done by considering the results of satellite image or topographical maps analysis, so it would be more efficient in geological mapping according to the desired scale. In this paper we are more focus on the method of smart mapping because this method is most often used by geologists.
- Smart mapping is used for several reasons, such as that the mapping area is too large, mapping time is too short, or lithological variations are relatively homogeneous. While systematic mapping is used when variations of lithology are very complex so observation of some point isn’t enough to represent all lithologies and structures in the mapped area and the availability of sufficient time. Therefore it is very important to know the purpose of geological mapping before doing the mapping to desired area.
The key points of smart mapping are:
- Smart mapper will start by looking at aerial photos to determine where the available outcrop is and then make 2-3 traverses across strike to ground the photo interpretation
- Searching patterns will focus in on key areas of interest e.g. shear zones
- Less time is spent in areas where the rocks are uniform and a lower density of observations will serve.
- Most useful observations are the predictable geometrical relationships between bedding, cleavage, lineaments and folds as well as movement indicators for brittle and ductile shear zones
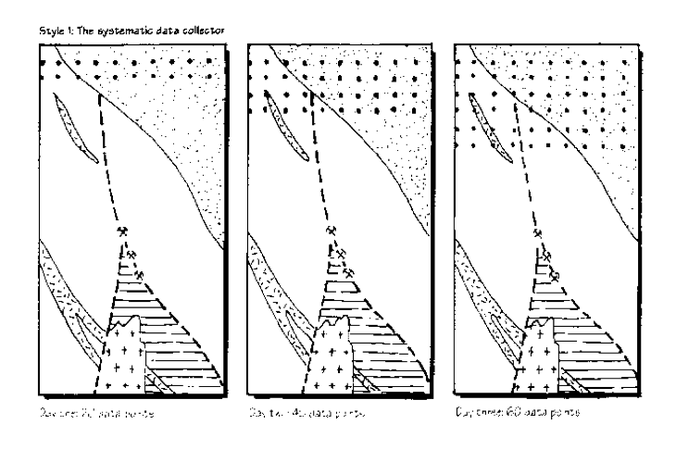
Figure 1 Illustration of systematic mapping (Derived from Pramumijoyo[1])
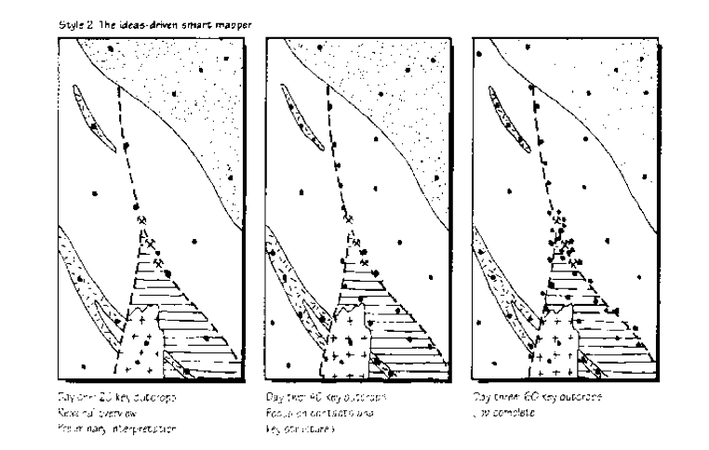
Figure 2 Illustration of smart mapping (Derived from Pramumijoyo[1])


Geological mapping is a process of problem solving. It is known as the system of multiple working hypotheses. (It is armed with a number of ideas about the geology developed from looking at published maps, literature, satellite image, aerial photographs, topographic map and/or gravity map). Prediction and interpretation is done to an area and field observations is to prove the results of the interpretation. Don’t be too focused to just one model.
Geological mapping is a scientific process and corresponds to the classic scientific method: theorizing, making predictions from the theories, and designing experiments (field observations or geochemistry analysis) to test the predictions.
Geologic mapping consists of three point stages:

Pre-mapping stage
Pre-mapping stage is performed before collecting data in the field. This stage is important because data is retrieved and the process that must be done when the mapping depends on the results of the pre-mapping analysis. This process is aimed to obtain early predictions about the area that will be mapped in the form of a tentative interpretation of geological maps, tentative interpretation of geomorphological map, making trajectory plan, lineament analysis, and making a plan or schedule for geological mapping.
Analysis of images and topographic maps
The initial step that should be done is secondary data collection. This data will be the basis for interpretation of pre-mapping. Required secondary data are:
- Topographic map
- Satellite images
- Regional geological map
- Land use map
- Geological research for area that will be mapped
- Geological maps of mapping area (if available)
After all secondary data collected, analysis process can start. The aim of the analysis process is to determine the following points:
- Landscape and strike/dip of bedding
- Distribution of rock units or formations
- Geological structure pattern
- Tentative maps
How to interpret strike and dip of bedding rocks from images or topographic maps


Determining the direction of strike and dip can be done by looking at the secondary data. The result of this determination is still tentative and should be checked in the field. Steps for determination of strike or dip of rock layers through a topographic map are as follows:
- Choose a hill or high topography that extends
- Pull the longitudinal direction of the hill or high topography as the direction of strike
- Direction of dip is determined by looking at the density of contour lines on both sides of the line of strike that has been withdrawn
- Direction of dip is parallel to the most tenuous density contour of both sides of the strike
Make tentative geomorphological map

A map that’s used as a basis to draw the boundary unit of geomorphology is a topography map. Topographic maps depict clearly the different reliefs that appear on the surface of the earth. Different reliefs are caused by differences in the type of lithology, geological structure, and exogenic processes that control the morphology. Satellite image and Digital Elevation Model (DEM) can be used as supporting data to clarify the morphology of the mapping area.
A tentative geomorphological map is drawn up early because morphology is the the most easily seen and identified appearance. Morphological changes reflect differences in lithology, geological structure, exogenic process, and time.
Determining process of geomorphology unit boundary can be done with following steps:
- Create a boundary line unit by taking into differences in density of contour lines (dense and loose)
- Make a geomorphological section in certain direction to be certain of the limits of morphological unit
- Create the pattern of morphological lineament (ridge) and geological structures (valley)
- Based on the characteristics of stream patterns, lineaments, and density contour, morphological units are named, better use morphogenesis name because it represents landscape and processes that influence.
Make tentative geological map
Tentative geological map is a map that is subsequently created, the boundary of geomorphological units that are made in geomorphological map will be reused in making a tentative geological map. Geomorphological unit boundary also represents different types of litology.
To determine the litology that may compose each litological unit can be used several indicators, such as:
- Different kind of vegetations, vegetation sometimes represents the difference of litology. For example teak trees usually grow above carbonate rocks. Although not usually true, but the data is quite useful as a first approximation.
- Roughness and fineness of the contour line patterns, contour line pattern may also indicate differences in litology. Dense contour line pattern indicates solid and hard rock such as metamorphic rocks, igneous rocks and sedimentary rocks that are resistant while the smooth contour line pattern indicates sedimentary rocks that are not resistant (e.g. mudstone).
In the tentative geological map we can also draw a lineament that estimate the geological structures such as faults. Fault is marked by the change of contour line patterns drastically or shifted in a narrow area. Estimated geological structure will facilitate observations in the field to look for evidence of the structure.
Tentative geological map is conjectural and therefore we should investigate the truth in the field. But the geological map is very useful as a guide in geological mapping plan, because the main object of mapping is to find the boundary of geological units and geological structure, so that the field observations can be focused on areas that indicate differences in litology from tentative map.
Make traverse plan
Determination of track plan is a step that should have been done before go to field. Geological mapping for areas that have tropical climate, with the possibility of limited data mostly use smart mapping.
Trajectory mapping is mapping done by combining several observation points. Two things to be noted are: efficiency of trajectory direction and location selection of the observation point. Efficient track direction is the direction perpendicular to the common dip or perpendicular to the longitudinal axis of the fold or spreading of rock or lengthening morphology element. For more efficient, before go to field create a map of the distribution of the main road to the footpath and distribution of streams and valleys Find the intersection direction of the road and the river is approximately perpendicular / angular blunt with unit geomorphic boundary (relief : are allowed so synonymous with boundary of litology units). Plan a cut off point as stop site for observation. While in the field, there are some basic criteria that can be used to make the observation location:
- a common contact-lithology boundary (don’t forget that the geological maps essentially is a map that illustrates the spreading direction contacts!)
- The point where the common boundary morphology is sharp (perhaps also the contact between rocks).
- The place where the common structure (fault, stocky, folds, etc.)
- The point where (1) to (3) don’t exist but there are good or complete outcrops
- The point where there is found positive geological potential and/or negative potential such as landslide, etc
- Point somewhere where possible morphological descriptions in the other direction (from a height in the direction of lower or of the plain towards the hills around
- Points on a map that distance more than 2 cm from another point.
Make schedule on the field
- Note the availability of time. Whether to spend one full month? 3 weeks? Decide first. Note to glance topography maps, to see accessibility. Does it take a lot of time or medium?
- Determine the time design. Is in field for a week, two days off? Or four days field, one day off? Why should there be a day off?
- Check field notes. Are they well organized? Sloppy field notes make a messy interpretation. Bad sample management can be a real headache. Working twice in the same stop site could happen.
- Update the field strategy. Plan alternative or new trajectories. The initial trajectory plan may need to be corrected, and your time off is a good time to revise.
- Rest
- Refer to the tentative lithology or geological map. Certainly on the tentative lithology or geological map, will appear relationships of stratigraphic units and the possibility of geological structure.
- Notice possible contacts. Will there be continuing, discontinuing, or interfingering? Strategic locations where outcrop of stratigraphy is found (river valleys, escarpment erosion, mining areas, etc.)
- Where is the estimates locations that have interpretive structures on the map? Locations to be visited: the possibility of a fault, peak / fold axis, the wings of fold, etc;
- If you already understand this passage, mark it on the new topographic map (clear) as a sign founded stop site. Create as much as possible in the confines of the unit and structure.
- The time plan and the distribution of stop site points create relationships between nearby stop site. Tracks should be sequential and don’t jump around. Create a closed path (circular) so that there are trajectory that leave basecamp and back to basecamp. Its function is to crosscheck and facilitate the achievement of the coverage area of study.
Mapping stage
What should be prepared?
- Mapping tools: Geological field is about tools. What tools are appropiate to use in the field. Geologist should know about the tools, it will be easier if we know the right tools that we need to use in the field. The tools are:
- Geological hammer: Its use to take a sample of rocks or many physical data. There are two kinds of hammer :
- Pick point (for crystalline rocks or hard-rocks)
- Chisel point (for sedimentary rocks or soft-rocks)
- Geological compass: Its used to measure the direction of strike-dip, slope and structural geology. There are many types of compass, such as Brunton compass, Topochaix- Universal compass, and many more. But we usually using Brunton compass.
- Geological loupe: It’s used to detail-observed the rocks. The rocks compose many macro until micro minerals and materials. That’s why we need to use it.
- Hydro-chloric acid solution with 0.1 M: If we work in carbonate fields, we need to use it to distinguish the carbonate rocks and non-carbonate rocks. If there is carbonate, it will be fizzing. In Indonesia, absolutely Java island, carbonate fields are abundant in Southern Mountain zone, Kendeng zone, Rembang zone.
- GPS (Global Positioning System): It is used to determine our location in the field. GPS working with coordinate system. Coordinate systems are UTM (Universal Transvere Mercator) and Longitude-Latitude system. We usually use UTM because it’s easier to check in the field.
- Sample bag: We need it to save and keep our sample. It should be strong, water and tear resistant, and big enough for our sample that has at least hand-specimen size.
- Fieldnotes: It is used to write all of data and make a sketch. Keep the fieldnotes from water, fire, and anything which will make your lose the data.
- Map: The map can be topographic map or your tentative maps. It is used to make traverse for our track, make a boundaries of lithology, and to write all of field data.
- Grain Comparator: Its used to distinguish the grain size. Its very useful for sedimentary rocks. We can knows the grain size more detail.
- Jacob Stick: It’s used to measure the stratigraphic on the outcrop.
- Stationery: To write and make the data collecting easier.
- Bags: To collect samples and also bring all of the tools and stuffs for mapping, so it will be easier to carrry anywhere.
- Stratigraphic Measurement Sheet: To record the stratigraphic data based on our measurement at the field.
- Digital Camera: To take a documentation in the field. Every sketch will be better if we take the documentation of it, too. It’s used to knows the other non-geological data at the field.
- Geological hammer: Its use to take a sample of rocks or many physical data. There are two kinds of hammer :
- Safety first: Before we go to the field, we should prepare all of mapping tools, include safety equipment. It is very important, cause it’s concern about our safety. We don’t know what will happen at the outside. Many dangerous things like reptiles or insect bites, the rebound of rock-particles while we samping, or hitting by hammer, it has probability to happen. So we should be well-prepared. The standard suits to use are:
- Safety shoes
- Safety glasses
- A long-sleeves suit
- Gloves
- Raincoat and Jacket
- Mask/buff
- Cap/field cap
- Safety helmet (Important if we go down to hole or cave)
- First-aid medicine
- Knowledge about first-aid healing
- Knowledge about emergency contacts
- Etiquette is important: As geologist, we should know and respect the local culture. We should know the ethic codes as a scienstist. Every civilization have different culture, and if we’re involved in it, we should obey the culture and the rule of life. Begin for a simple things such as:
- Ask for permission to government and civil organization before we start to mapping.
- Do not littering
- Do not kill anything except time
- Do not make a violences
- Respect all of local residents, examples if we meet with the residents, give him/her a warm greetings and trying to speak about another topics.
- Do not take anything except somethings you need, such as samples. Take samples appropriately.
- Obey the local rules and respect the folk story. It is real, and don’t underestimate.
Getting started in mapping
- Know the direction and record it: Before we start, we should determine the direction and decide the track. It will be more simple if we make Traverse Map that contains our tracking plan. There are two kinds of mapping track, i.e. open polygon and close polygon.
- Open polygon means that we doing mapping from the first point > second point > third point and so on, until the finish point is not the first point in one day. It’s like a rally track, the start point is not the finish point.
- Close polygon means that the start point same as finish point. So we make a full-polygon in one day mapping. We can choice which one better, look at the topographic, track condition, mapping method, and times. Dont forget to traverse our track every time we go tracking. We can mark our track on topographic map or secondary map.
- Finding an outcrop: To take a data, we need outcrop. It is very important thing that we will need in mapping project. It’s highly recommended to find a fresh outcrop, cause the data are more accurate and well-recorded. The condition of topographic can affect the abundant of outcrop. In exposed area, it will be easier to find outcrop than in unexposed area. It happens in Indonesia, cause Indonesia has tropical climate so the erosion is intense. It will be easier to find a soil than a fresh rocks. So to overcome that, we need to look for the indirect evidence such as:
- Soil colors, signing what is the original rocks, taking from man-made holes, animal burrows, or cliff.
- Vegetation, can show the bedrocks. For example, limestone appearance is signing with the juniper or beech.
- Go to the river, and look at the river banks. It will be more effective cause every river bank certainly eroded and the bedrock can be exposed.
- Go to the structural geology area, it can indicate the uplifted or unresistant rocks. You can know it from secondary mapping by interpretating it.
- Finding a boundaries and contacts: To find a lithology boundaries, you should know the dipping. Law of superposition said that “the oldest rocks is sedimented under the youngest rocks, except structural was controlled it”. To find a youngest rocks, we should walking cross and perpendicular the dip. You can find a lithology contact. Before you find it, literature study is the main target.
- At the stop site
- Data recording: Notes that there are things that we should do while data recording, it is recording with detail and correctly, don’t manipulate the data.
- Sketch: For drawing sketch, preffered to draw the geological data. Other geological data such as vegetation, civil objects are additional.
- Sampling: For taking sample, we should know the procedure so that we can do it safely. First, use your safety suit (safety glasses, gloves, mask, and helmet) to protect from the rebound of rock particles. We should know that what we’re sampling is hard rock (igneous or metamorphic rocks), soft rock, or unlithified sediment. If hard rock, we use pick point hammer. Notes that it is more dangerous because it’s more dense than sedimentary rocks or unlithified sediment, so it can produce many sharp particles that can wound our body. For soft rocks, use a chisel point hammer. Don’t forget to put our sample in the sample bag and give note about the information of stop site like a number of stop site, date, sample number, and observator name.
- Stratigraphic measurements:
- It’s important thing to do, because we can know more about the rocks strata and correlate them to predict a geological history. Many stratigraphic science can use to interpret the history, they are:
- Biostratigraphy, using fossils (biological data) to determine the rock groups in strata
- Lithostratigraphy, that’s the same kinds of rocks is the same group in strata
- Magnetostratigraphy, it depends on magnetic reversals
- Chemostratigraphy, depends on temporal exursions and sequencial changes in chemical characteristics
- Sequence stratigraphy, depends on progression of sedimentary rocks in sea level changes
- To make a stratigraphy successions, we need a Jacob stick, it’s a 150 meters stuff with a sign delimiter every 10 centimeters and clinometer in the top part and also we need stratigraphic measurements sheet. The steps to do the measurements are :
- Determine the outcrops or ways to measure. It should be:
- Showing the well bedding
- Avoid the geological structure like a fault
- Before we use the Jacob stick, we should make sketch of bedding. It will help us to make the measurement efficiently.
- Place the Jacob stick perpendicular with bedding. Use the clinometer to measure dip, so that Jacob stick can be perpendicular with the bedding.
- Every Jacob stick has 10 cm interval every red-white line. It’s used to measure the width of bedding. Keep place perpendicular with the bedding.
- Determine the outcrops or ways to measure. It should be:
- It’s important thing to do, because we can know more about the rocks strata and correlate them to predict a geological history. Many stratigraphic science can use to interpret the history, they are:
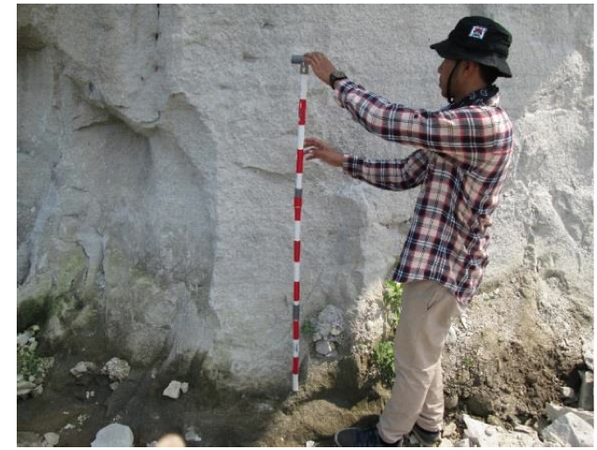
The Jacob staff should be perpendicular with the bedding (Source : Stratigraphy Principle mapping archive)
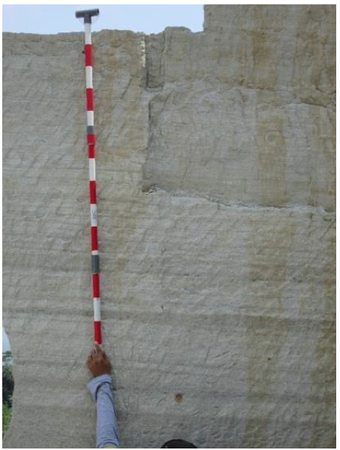
(Source : Stratigraphy Principle mapping archive)


Post-mapping stage (reading a geologic map)
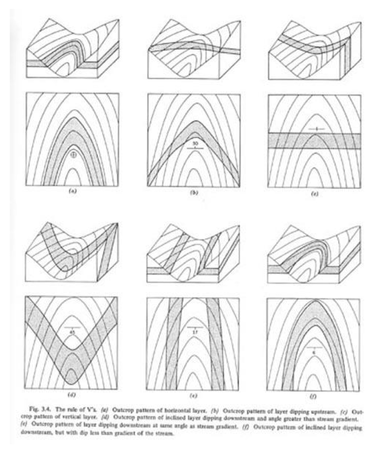
V Rules (Derived from Sukandarumidi[2])
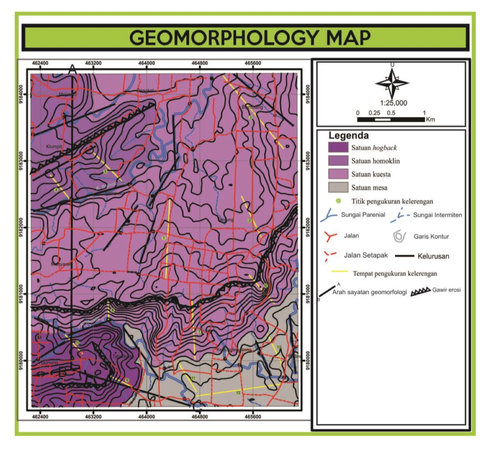
Geomorphology Map[3]
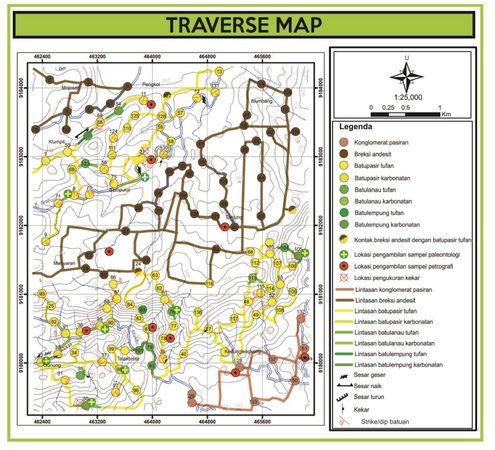
Traverse Map[3]
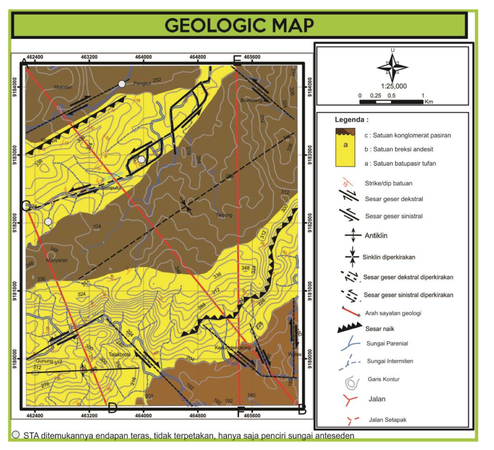
Geologic Map[3]
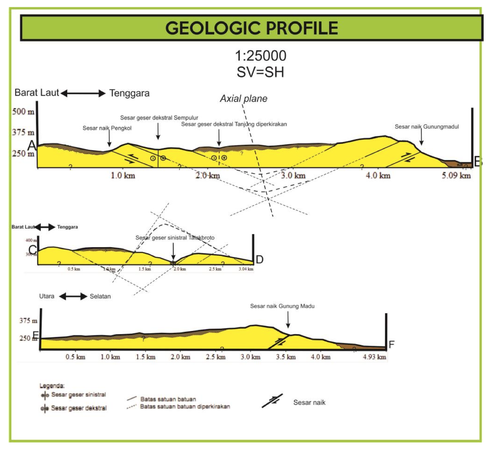
Geologic Profile[3]


After collecting geological data (such as lithology, geological structure, and geomorphology) from field observation, the next step that should be done is the poster which consists of points of observation’s map, geological map, geomorphological map, stratigraphic column, geological history, and photos and diagrams from petrography, paleontology and structural geology analysis. Those data and maps should represent your field geologically.
The first thing that you need to make is the poster. The poster is consist of:
- Cover Page (with title and your name)
- Points of Observation’s Map
- Geological Map with Profile and Legends
- Geomorphological Map with Profile
- Stratigraphic Column and Its Information
- Geological History that’s arranged based on the stratigraphy and structure of the area
- Photos and Diagrams from Laboratory Observations or Analysis
- Bibliography
- Validity Sheet
- Attachments (photos, sketches and diagrams that are optional)
Poster must be arranged with a logical line of reasoning and neatly structured. Below is the explanation about each components of the poster:
- Cover Page: The cover page is consist of the title of poster (includes the village, town, city and country of the mapping area), name of the writer (full name and student id number), symbol of university/college or institutions, and date of published.
- Traverse Map: The procedure about how to make this map have been mentioned in the pre-mapping phase. This map explains about the route that you’ve observed in mapping. Each points symbolize an area that you’ve visited to do some field work such as lithology descriptions, measured sections and strike/dip measurements. There will be some tracks which connect points that are nearby. The component of this map is almost the same as geological map, but with addition of the number of points and tracks in the legend and also the body of the map. From every point of stop side, we can see the lithology of every stop site by the lithology symbol.
- Geological Map with Profile and Legends: From this map, you will know the information about distribution of rocks, the relationship between the rock units, the geological structure and the order of the rocks. The map is consist of title, scale, legend, coordinate, lithological symbol, contour, geological structure symbol, strike/dip, river and administrative location. And also a geological profile by making section in the body of the map.
- Geomorphological Map with Profile: This map explains about the distribution of geomorphology. It’s consist of title, scale, legend, geomorphological symbol, contour, coordinate and also the used classification of geomorphology. And also a geomorphological profile by making section in the body of the map.
- Stratigraphic column and its information: This column explains about the order of lithology based on the geological age and also the relationship between the rocks unit. From this column, we can know the depositional environment of the rocks.
- Geological History: From all geological data that you’ve got, you will make interpretation of the geological processes and depositional environment of the mapping area. From the interpretation, you will make a narration that’s full of facts that you’ve got from your work in field and laboratory. The narration will explain about the geological processes and the change of depositional environments from the oldest age to now.
- Photos and Diagrams: Photos from petrography and paleontology observation in laboratory may be put in the poster to support the map and interpretation that you’ve made. Diagrams from geological structure analysis also may be put on a show on the map.
- Bibliography: All of the literature and books, papers, and other publications that support your work during mapping should be written in Bibliography page.
- Validity Sheet: Before the poster is shown to public, it must be signed by the advisor or the lecturer to inform that this poster is able and good enough to be published.
- Attachments: This page is optional. If there’s some data such as sketches, or other photos and diagrams that you want to add. You can add it in attachment page.
To make geological map and geomorphological map correctly and based on the data that we got from field observation, there are some rules that we need to apply in making the map. Below is the rules and the right procedure about how to make map:
- The accuracy and precision of geological map is mainly based on the scale of the map that you want to make. The greater scale means the more accurate the map that you make. For example, 1 : 25000 scale is more accurate than 1 : 50000 scale. Also the greater scale will make you get more geological information than the smaller scale.
- To make a boundary between two different rock units, we need to measure strike and dip in field observation. And also we need to pay attention closely to any contact between two different rock units that we found in the field. More value of strike and dip means the more accurate the geological structure construction and more rocks variance.
- To decide the boundary, we can apply the “V Rule”, which has these principle points below:
- If the dip of bedding is 0° or <5°, the boundary will be drawn by following the contour line.
- If the dip of bedding is > 5°, if the direction is the same as the dip of slope from topography, then the boundary will be drawn by cutting off the contour line but a bit inclined to downward. And if the direction is the opposite of the dip of slope from topography, then the boundary will be drawn by cutting of the contour line but a bit inclined to upward. Both appearances will be seen if the boundary is cutting of the river line.
- This rule is not applicable in a field where there’s fault.
- This rule is also not applicable in a field that has igneous and metamorphic rocks.
- To make cross sections, we need to make a line for a cross section which will show the appearance of the distribution of all rock units in the field and also the geological structure. Usually, the direction of the cross section is from north to south with a low or steep dip.
Conclusion
Geological mapping is a basic stage in the more complex geology analysis. The final results of geological mapping is a geological map that contains important information such as variation of litology, geological structure and stratigraphy. Stage in geological mapping is pre mapping, mapping, and post mapping. Each stage has an important role so that the geologic skills is needed to produce awasome geological maps.