Shale-oil resource systems
| Shale Reservoirs: Giant Resources for the 21st Century | |
| |
| Series | Memoirs |
|---|---|
| Chapter | Shale-oil Resource Systems |
| Author | Daniel M. Jarvie |
| Link | Web page |
| PDF file (requires access) | |
| Store | AAPG Store |
Producible oil from shales or closely associated organic-lean intraformational lithofacies such as carbonates is referred to as a shale-oil resource system. Organic-rich mudstones, calcareous mudstones, or argillaceous lime mudstones are typically both the source for the petroleum and either a primary or secondary reservoir target, but optimum production can be derived from organic-lean juxtaposed carbonates, silts, or sands. Where organic-rich and organic-lean intervals are juxtaposed, the term hybrid shale-oil resource system is applied.
These systems are classified as (1) organic-rich mudstones without open fractures, (2) organic-rich mudstones with open fractures, and (3) hybrid systems that have juxtaposed, continuous organic-rich and organic-lean intervals (Figure 1). For example, the Bakken Formation production is accounted for by both open-fractured shale (e.g., Bicentennial field) and hybrid shale (e.g., Elm Coulee, Sanish, and Parshall fields), where organic-rich shales are juxtaposed to organic-lean intervals, such as the Middle Member (dolomitic sand) and Three Forks (carbonate). However, Barnett Shale oil is almost always from a tight mudstone with some related matrix porosity.[1] Monterey Shale-oil production is primarily from open-fractured shale in tectonically active areas of California. Various shale-oil resource systems are classified based on available data in Table 1. To suggest that these types are mutually exclusive is also incorrect because there can be a significant overlap in a single shale-oil resource system.

Although shale-oil plays with oil stored in open-fractured shale have been pursued for more than 100 yr, organic-rich and low-permeability shales and hybrid shale-oil systems are now being pursued based on knowledge and technologies gained from production of shale-gas resource systems and likely hold the largest untapped oil resource potential. Whereas fractured and hybrid shale-oil systems have the highest productivity to date, organic-rich tight shales are the most difficult to obtain high oil flow rates because of ultra-low permeability, typically high clay and low carbonate contents, and organic richness whereby adsorption plays a role in retention of petroleum.
A special, but separate, shale resource system is oil shale. It is preferred to refer to oil shale as a kerogen resource system or as kerogen oil as it does not contain sufficient amounts of free oil to produce, but must be heated to generate oil from kerogen either in the subsurface or after mining and retorting. This 2d part of chapter 1 will only discuss shale-oil resource systems that have already generated petroleum because of geologic heating processes.
With the remarkable success in locating and producing shale-gas resource systems, an overabundance of gas has reduced its current economic value and there has been an exploration and development shift toward locating producible shale-oil resource systems. Recent announcements of the oil resource potential of several shale-oil resource systems have substantiated the volume of oil they contain, for example, 5.88253 times 107 m3 (370 million bbl of oil equivalent [BOE]) in the Barnett Shale, 1.430886 times 107 m3 (90 million BOE) in the Bakken Formation core area, and 1.430886 times 108 m3 (900 million BOE) in the Eagle Ford Shale.[1] However, the keys to unlocking these high volumes of oil are not fully understood or developed to date.
Background[edit]
Identifying source rocks in the oil window is the first step to identifying areas of potential petroleum exploitation. However, the oil window must be considered carefully because the oil window does vary, depending on the source rock, although thermal maturity values from about 0.60 to 1.40% Ro are the most likely values significant for petroleum liquid generation. Regardless of thermal maturity, there must be sufficient oil saturation to allow the possibility of commercial production of oil.
Although an organic-rich source rock in the oil window with good oil saturation is the most likely place to have oil, it is also the most difficult to produce, unless it has open fractures or an organic-lean facies closely associated with it. This is due to molecular size, viscosity, and sorption of oil. However, juxtaposed organic-lean lithofacies such as carbonates, sands, or silts in shale-oil resource plays are very important to higher productivity due to short distances of secondary migration (where secondary migration is defined as movement from the source rock to nonsource intervals;[2] added storage potential, and low sorption affinities. Secondary migration is defined as movement from the source rock to non-source intervals that also results in some fractionation of the expelled oil with heavier, more polar components of crude oil retained in the organic-rich shale. Juxtaposed means contact of organic-rich with organic-lean intervals regardless of position (overlying, underlying, or interbedded). Petroleum that undergoes tertiary migration would move outside the shale resource system and this would account for conventional petroleum or other unconventional resource systems. Even in a hybrid shale-oil resource system, the source rock itself may be contributing to actual production and may be considered as a component of the oil in place (OIP).
Processes involving the generation of carbon (CO2) and organic acids have been postulated for the creation of secondary porosity in conventional petroleum systems[3] but have mostly been discounted because, in part, of the low volume of generated acid relative to carbonate. However, this process appears quite important in unconventional carbonate-rich shale-oil resource systems. Acid dissolution of carbonates as a source of secondary porosity has been cited in the Bakken Middle Member along with thin-section substantiation.[4] The acid source is presumed to be organic acids released during kerogen diagenesis,[4] but acidity is also derived from the CO2 released from both kerogen and pre-oil window release of CO2 from thermal decomposition of siderite-forming carbonic acid. Immature Bakken shale was found to release large amounts of carbon dioxide under relatively low hydrous pyrolysis conditions (225–275degC [437–527degF])[5][6][7] likely from kerogen diagenesis. The release of CO2 also explains the apparent increase in hydrogen indices during diagenesis, which is but an artifact of organic carbon loss. In addition, carbonates will also release CO2 under increasing thermal stress, with siderite being the most labile (pre- to early oil window); dolomites, more refractory (highly variable late oil–to–dry gas windows); and calcite, in metagenesis.[8]
Carbon dioxide in saqueous solution during kerogen diagenesis (i.e., pre-oil generation) is also a source of pressure increase in a closed system aiding the creation of potential conduits for petroleum migration. Ultimately, in contact with carbonate rocks, these acids will eventually result in mineral-rich (e.g., Ca++) solutions that precipitate. This was also shown by the carbon isotopic analysis of calcite cements, by Pitman et al.,[4] that were shown to be derived from marine carbonates.
Although kerogen diagenesis and carbonate minerals are sources of CO2 and organic acids, Gaupp and Schoener[9] noted the potential of alkanes to be converted to acids.
A moderate to high quartz content has played a significant role in allowing shale-gas resource systems to be stimulated because of their contribution to rock brittleness. Derivation of this quartz has largely been from biogenic sources instead of detrital, meaning it is closely associated with organic matter. As such, this close association with organic matter inhibits oil flow not only because of lower permeability in an organic-rich mudstone, but also because of adsorption to organic matter. However, in organic-lean rock, adsorption is minimized, thereby enhancing the possibility of free oil flow, with the remaining obstacle of overcoming low permeability in the typical tight-oil resource system by stimulation or hydraulic fracturing.
Adsorption plays a very significant role in unconventional resource plays. It accounts, in part, for the retention of oil that is ultimately cracked to gas in shale-gas systems and provides varying amounts of adsorptive storage in shales (as well as in coalbed methane). Oil expelled into organic-lean lithofacies does not exhibit the high adsorption affinities found in organic-rich mudstones, thereby allowing better production characteristics. The molecular size of crude oil is important, but its adsorptive affinities may be equally or even more important in flow rates. Based on experimental data from Sandvik et al.,[10] only 14% of resins (polar compounds of low viscosity) is expelled, whereas 86% of this oil fraction is retained in the source rock. A much higher percentage of nonpolar saturated and aromatic hydrocarbons are expelled (sim60%), with the balance being retained under the closed-system experimental conditions that Sandvik et al.[10] used.
The interaction between the molecules in a shale-oil resource system is principally that of physical, chemical bonding. The behavior of the system is different in situations where the condensed phase has a fixed solid structure to which the volatile substance adheres, as opposed to cases where the condensed phase is a fluid, which (by definition) does not have a rigid solid structure. Inasmuch as sedimentary organic matter may be composed of both liquid or solid components, and quite commonly a heterogeneous mixture of both, then both processes of physical bonding (adsorption and solvation [commonly called absorption]) may be presumed to occur. Adsorption and solvation both entail some degree of solvent swelling, by which the molecular surface area available for physical bonding actually increases in the presence of the volatile substance. Inasmuch as these adsorption and solvation processes cannot easily be discriminated and the degree of solvent swelling is commonly unknown, the term sorption, instead of adsorption, is commonly used.[11]
Oil content in rock samples[edit]
An approach that was used in the early days of geochemistry to characterize the oil content of sedimentary rocks was extracting reservoir rocks with solvent and normalizing the yield against TOC.[12] With the advent of the Rock-Eval with TOC instrument,[13] an expedient approach became available to geochemists to make a comparable assessment of oil contents without performing the solvent extraction procedures and a separate TOC analysis. In this approach, free oil from the rock is thermally vaporized at 300degC (572degF) (all Rock-Eval microprocessor temperatures are nominal temperatures, with actual temperatures typically 30–40degC [86–104degF] higher) instead of solvent extracted, thereby giving the measured oil content (Rock-Eval S1 yield). A comparison of solvent extract of rocks to Rock-Eval S1 indicates that solvent extraction (depending on the solvent system) is more effective at extracting heavier petroleum products, whereas Rock-Eval S1 is more effective at quantitating the more volatile fraction of petroleum.[14] With recent work in shale-gas resource systems, it is evident that a part of the petroleum is trapped in isolated pore spaces associated with organic matter[15][16] that were described as microreservoirs by Barker.[17] These isolated pores contain free oil or gas that rupture at the higher temperatures experienced during pyrolysis, thereby eluting in the Rock-Eval measured kerogen (S2) peak as do high-molecular-weight constituents of bitumen and crude oil.
Thus, to obtain the total oil yield from a rock sample by Rock-Eval thermal extraction, it is necessary to analyze a whole rock (unextracted) and an extracted rock sample where

This combines any free oil that elutes in the Rock-Eval S1 peak with heavier or pore space trapped oil that elutes from Rock-Eval in the pyrolysis (S2) peak. Certainly, not all of the total oil or extractable organic matter (EOM) is movable oil, but the free oil, as measured by S1, is the more movable oil fraction in the reservoir rock. This oil or bitumen retained in the rock until pyrolysis demonstrates the difficulty of recovering a high percentage of OIP out of an organic-rich tight shale.
Oil crossover effect[edit]

A geochemical indication of potentially producible oil is indicated by the oil crossover effect, that is, the crossover of oil content, either Rock-Eval S1 or EOM relative to organic richness (TOC, absolute values), or when the oil saturation index (OSI) (S1 times 100/TOC) reaches a value of about 100 mg hydrocarbons (HC)/g TOC. This is illustrated by graphic results describing Upper Jurassic Bazhenov Shale open-fractured shale-oil production. These data values are derived from the graphic of Lopatin et al.[18] for Bazhenov shales in the 11-18-Maslikhov well, and they clearly show the oil crossover effect and the productive intervals (Figure 2). Such high crossover in an organic-rich shale is indicative of an open-fracture network.
Rock-Eval S1 or EOM yields alone have little meaning in assessing potential production because they do not account for the organic background. For example, coals might have an S1 value of 10 mg HC/g rock, but with a TOC of 50% or higher, the OSI is quite low, indicative of low oil saturation with a high expulsion or production threshold.
An empirical value exceeding 100 mg oil/g TOC was used to identify potential reservoir intervals in a conventional reservoir in the Anadarko Basin[14] and similarly in vertical Monterey Formation wells.[19] Data from Sandvik et al.[10] and similarly by Pepper[20] suggest organic matter retains a portion of generated petroleum cited by both authors to be about 10 g of liquids sorbed per 100 g organic matter, that is, 100 mg HC/g TOC. Thus, there is a resistance to oil flow until the sorption threshold is exceeded, that is, values of OSI greater than 100 mg hydrocarbons per g of TOC. As Rock-Eval S1 is not a live oil quantitation, but instead a variably preserved rock-oil system, there is certainly loss of light oil due to evaporation, sample handling, and preparation before analysis. Loss of S1 is often estimated to be 35%[21], but it is highly dependent on organic richness, lithofacies, oil type (light or heavy), and sample preservation. Organic-lean rocks such as sands, silts, and carbonates as found in conventional reservoirs would have a much higher loss than organic-rich, low-permeability mudstones. Drying samples in an oven will certainly impact the free oil content in Rock-Eval S1. Oil-based mud systems preclude the use of the Rock-Eval S1 and OSI.
Although an oil crossover value of less than 100 mg HC/g TOC does not rule out the possibility of having producible oil, it does represent substantially higher risk based strictly on geochemical results. It may be that samples have been dried or more volatile liquids have evaporated, particularly in conventional reservoir lithofacies.
Finally, it is not only important to locate oil reservoirs, it is important also to assess the quality of the oil contained in the reservoir. Such techniques have been described[22] and are an essential part of assessing the economic value of a reservoir. Basic tests include determination of sulfur content, API gravity, viscosity, and yield of polar resin and asphaltene relative to nonpolar saturate and aromatic hydrocarbons. A quick screening approach is to use gas chromatography to predict oil quality based on the fingerprint derived from the rock extract; this is the same tool used on produced oil samples or recovered from reservoir tests.
Oil crossover effect examples[edit]
The following section uses data from various shale-oil resource systems to illustrate the oil crossover effect using the OSI as well as other factors (carbonate content, thermal maturity, oil carryover, and high oil content not indicative of production). Many of these examples were real-time analytical data completed before well perforation and testing, thereby demonstrating the direct impact on completion activities.
Miocene Monterey Shale, Santa Maria Basin, California: Fractured Shale-oil Production[edit]
The first example of producible shale oil is taken from the Miocene Monterey Shale, Santa Maria Basin, California (see Appendix immediately following this chapter, location 49 on North American resource map). The Monterey Shale has been the source of substantial amounts of oil in various conventional reservoirs in this basin, but also produces from fractured Monterey Shale itself. In fact, the shale itself has yielded approximately 1 billion bbl of oil since 1900.[23]
An example of fractured Monterey Shale production is given by the Union Oil A82-19 Jesus Maria well drilled in 1987 located in Lompoc field, Santa Barbara County, California. Initial tests on the well above the interval from 1379.2 to 1437.1 m (4525–4715 ft) yielded 24.6 m3/day (155 bbl/day) of 17deg API oil and 481.4 m3/day (17 mcf/day), with a gas-oil ratio (GOR) of 19.5 m3/m3 (109 scf/bbl) according to a scout ticket for this well.
A geochemical log of this well demonstrates oil crossover in the 1371.6 to 1417.3 m (4500–4650 ft) interval (Figure 3). These results are from cuttings of this well that were archived and reanalyzed in 2010. The relatively high values for OSI suggest open fractures in the shale. The TOC values average about 2.2% with less than 25% carbonate. A deeper zone from 1493.5 to 1569.7 m (4900–5150 ft) shows a very high oil content but very little oil crossover and was not perforated. However, it would likely have flowed oil, although the rate would have been low, depending on oil quality. Whereas free oil yields (S1) are high (as much as 0.0108 m3/m3 or 80 bbl/ac-ft), there is also a very high remaining generation potential (S2) indicative of low thermal maturity, although some of this is likely extractable organic matter (EOM) carryover given the low API gravity of the oil. Thus, the total oil content is higher, and the S2 and HI are lower; extraction and reanalysis would provide the total oil yield. For example, data on whole rock and extracted rock from the Getty 163-Los Alamos well, Santa Maria Basin onshore, demonstrate that only 15–30% of the oil is found in Rock-Eval S1, whereas the bulk is found in Rock-Eval S2. This carryover effect is a function of oil quality, especially API gravity, but also the lithofacies.
Other examples of open-fractured shale-oil production include the Niobrara, Pierre,[24] Upper Bakken shale-oil systems,[25] and the West Siberian Jurassic Bazhenov Shale.[18]
A second Monterey Shale example is a deep Monterey Shale well drilled by Coastal Oil & Gas in a synclinal part of the onshore Santa Maria Basin. The Coastal Oil & Gas (O&G) Corp. 3-Hunter-Careaga well, Careaga Canyon field, flowed 53.9 m3/day (339 bbl/day) of 33deg API oil with 1.85 times 104 m3/day (653 mcf/day) of gas and 15 m3/day (95 bbl) of formation water from the Monterey Shale (scout ticket). It had a reported GOR of 343 m3/m3 (1926 scf/bbl). The well was perforated over numerous intervals from 2740 to 3711 m (8990–12,175 ft) with a maximum flow of 8.2 m3/day (516 bbl/day) and 2.20 times 104 m3/day (778 mcf/day). A geochemical log of this well illustrates its much higher thermal maturity, explaining the high GOR for a Monterey Shale well (Figure 4). The TOC values are variable, ranging from just under 3.00% to less than 0.50%. The highest oil crossover tends to occur where TOC values are lowest, suggesting variable lithofacies, but not open fractures as the oil crossover is marginal, reaching about 100 mg/g (average, 94 mg/g) in the 2793 to 3048 m (9165 to 10,000 ft) interval, with isolated exceptions over 100 mg/g at 3269 to 3305 m (10,725–10,845 ft) and 3580 to 3616 m (11,745–11,865 ft). Based on these data, the optimum interval for landing a horizontal would be in the 2903 to 2940 m (9525 to 9645 ft) zone, although multiple zones with OSI greater than 100 would flow oil. Additional oil likely exists in the pyrolysis (S2) peak because low TOC samples have substantial pyrolysis yields with some of the highest HI values, again indicative of oil carryover into the pyrolysis yield. Thermal maturity, as indicated by vitrinite reflectance equivalency (Roe) from Tmax, suggests maturity values spanning the entire oil window with the early oil window at 2743.2 m (9000 ft) and latest oil window at 3657.6 m (12,000 ft).
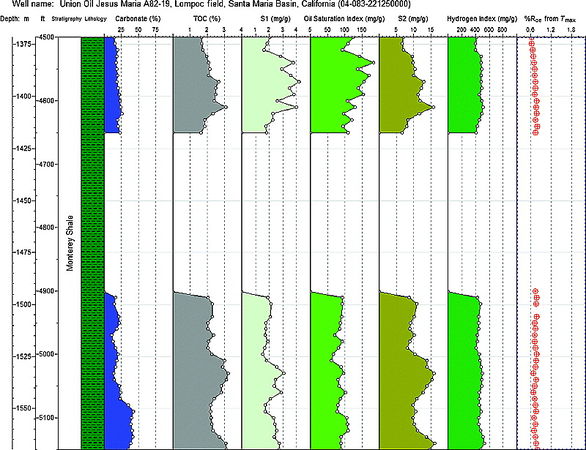
Figure 3 Union Oil Jesus Maria A82-19 Monterey Shale geochemical log, Santa Maria Basin, California. The oil saturation index (OSI) values exceed 100 mg oil/g TOC in the uppermost section of this Monterey Shale section, whereas the lowermost section shows a much thinner interval of crossover. TOC = total organic carbon; S1 = Rock-Eval measured oil contents; S2 = Rock-Eval measured kerogen yields.
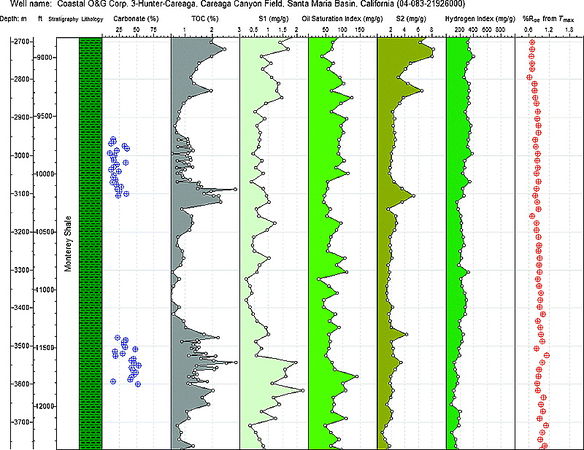
Figure 4 Coastal Oil & Gas (O&G) Corp. 3-Hunter-Careaga well, Monterey Shale geochemical log, Santa Maria Basin, California. TOC = total organic carbon; S1 = Rock-Eval measured oil contents; S2 = Rock-Eval measured kerogen yields.


This well was perforated over the entire Monterey Shale interval and did produce during a 5 yr period 2.60 times 104 m3 (163,603 bbl) of oil, 6.369 times 106 m3 (224,936 mcf) of gas, and 1.39 times 105 m3 (872,175 bbl) of formation water with the water cut increasing greatly in year 5 when the well was shut in.
Miocene Antelope Shale, San Joaquin Basin, California[edit]

Elsewhere in California, organic-rich source rocks are also found in the San Joaquin Basin. These shales, age equivalent to the Monterey Shale, are the Miocene Antelope and McLure shales that are also oil productive. An example is provided by the Arco Oil & Gas 1-Bear Valley well, Asphalto field in Kern County, California. In the early 1990s, Arco's Research Center and Humble Geochemical Services completed analyses of this well as a joint research project prompting completion of the well in the Antelope Shale. The geochemical results were later presented, showing the production of about 250 bbl of oil/day from the Antelope Shale.[19] Before completing the well, the prediction of API gravity was also completed using pyrolysis and geochemical fingerprinting techniques with the assessment of about a 30 to 35deg API oil based on correlation of rock data to produced oils with measured API gravities. The vertical well flowed approximately 38.95 m3/day (245 bbl/day) of 32deg API oil. The scout ticket for this well reports the completion interval as being 1621.5 to 1987.9 m (5320–6522 ft). The scout ticket also reports log-derived porosities in the 10 to 15% range.
A geochemical log of this well shows OSI gt 100 mg hydrocarbons/g TOC in the Antelope Shale over a broad interval from 1815 to 1998 m (5955–6555 ft) (Figure 5). Although a broader interval was perforated, the bulk of the producible oil appears to be located in the interval where oil crossover occurs. This would be the zone to target for perforation or landing a horizontal well. Oil crossover also exists in the Reef Ridge Formation.
Potentially recoverable oil is still in the range of 0.0116 m3/m3 (90 bbl/ac-ft) or 2.09 times 106 m3/km2 (34 million bbl/mi2). The OIP value is estimated to average approximately 2.93 times 107 m3/km2 (184 million bbl/mi2) based on total oil yields from Rock-Eval data. This is not corrected upward for any potential hydrocarbon losses caused by evaporation and sample handling.
It is also obvious from this log that the thermal maturity is quite low with an equivalent percentage vitrinite reflectivity in oil (% Roe) of 0.37. This is likely lower than would be measured on extracted rock because of the presence of oil; however, the Monterey Shale in California is known to generate oil at lower thermal maturities than indicated by Tmax or Ro values.[26][27] The Tmax values of 410 to 425degC (770 to 797degF) represent about 20 to 50% conversion of high-oxygen, high-sulfur Monterey Shale to petroleum.[28]
Devonian Bakken Formation, Williston Basin[edit]
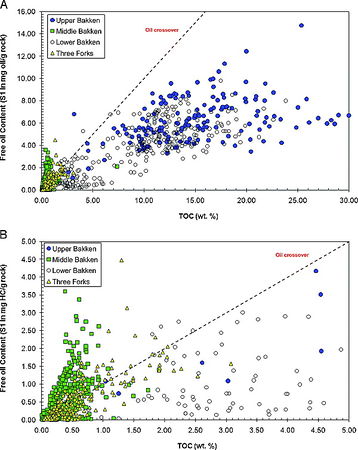
Figure 6 (A, B) Geochemical database of total organic carbon (TOC) and Rock-Eval analyses from the North Dakota Geological Survey.[29] A plot of free oil contents versus TOC illustrates the oil crossover effect of the upper Bakken Shale, Middle Member of the Bakken Formation, lower Bakken Shale, and Three Forks: (A) all data with up to 30% TOC, and (B) reduced scale emphasizing the Middle Member of the Bakken Formation and Three Forks data. S1 = Rock-Eval measured oil contents.
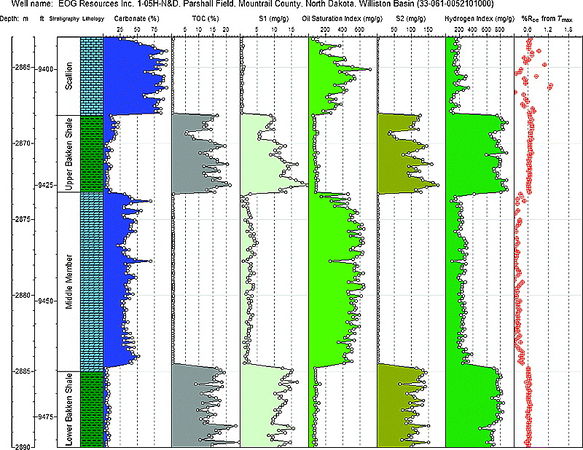
Figure 7 EOG Resources Inc. 1-05H-NampD geochemical log showing the geochemical results for the Scallion and Bakken formations. This log illustrates the oil crossover effect (S1/total organic carbon [TOC]) for the carbonate-rich Scallion and Middle Member. The upper and lower Bakken Shales are organic rich and carbonate lean but have high oil contents for the level of thermal maturity (sim0.60% Roe). The high oil contents in the Bakken shales are offset by the high retention of oil. S1 = Rock-Eval measured oil contents; S2 = Rock-Eval measured kerogen yields.


Production from fractured upper Bakken Shale has been ongoing since the 1980s from several fields in North Dakota including fields such as Bicentennial, Elkhorn Ranch, Buckhorn, Rough Rider, Demores, and Pierre Creek. Production reported by the North Dakota Geological Survey[25] for fractured upper Bakken Shale is approximately 3,714,699 m3 (23 million bbl), with an average GOR from all upper Bakken Shale production of about 426 m3/m3 (2395 scf/bbl).
An independent geologist, Dick Findley, proposed the idea of producible oil in the Middle Member of the Bakken Formation in 1995, leading to the discovery of the giant Elm Coulee field in eastern Montana in 1996 with the first horizontal well drilled in 2000.[30] Taking Findley's idea, independent geologist Michael S. Johnson extrapolated the idea into Mountrail County, North Dakota, which is located on the eastern flank of the oil window based on various investigators.[31][32] Although the same facies of the Middle Member as found in Elm Coulee did not extend that far east, the Middle Member was still charged with oil as shown by the discovery well, the 1-36H-Parshall well that flowed 73.6 m3 (463 bbl/day) of 42deg API oil and 3624.5 m3/day (128 mcf/day) with a GOR of 49 m3/m3 (276 scf/bbl). The next well, the 2-36H-Parshall, flowed 140 m3 (883 bbl/day) of oil and 7079 m3 (250 mcf/day) of gas, yielding a GOR of 50.4 m3/m3 (283 scf/bbl). Recent production from Parshall and Sanish fields typically ranges from 318 to 636 m3 (2000–4000 bbl/day) using very long laterals (as much as 3044 m; ~10,000 ft).
The Parshall field has proven to be a major field covering more than 3840 km2 (950,000 ac). The North Dakota Department of Mineral Resources projects estimated recoverable oil at 3.331 times 108 m3 (2.1 billion bbl), representing less than 1.5% of OIP.[33]
However, this area of the Williston Basin was largely ignored because it was thought that it was too immature for petroleum generation and the Middle Member was too tight to serve as a conduit and reservoir for migrated hydrocarbons. Upper Bakken Shale in this area is classically characterized as immature to earliest oil window thermal maturity (%Roe from Tmax of 0.58–0.65). The lower % Roe from Tmax (0.58) is from whole rock that contains both oil and kerogen, whereas the upper value (0.65% Roe) is from extracted rock, which is only kerogen and more accurate. This also demonstrates that some oil carryover into the Rock-Eval S2 peak also exists, even in the presence of high API gravity oil. When normalized to TOC, extracted oil from S2 retained in the Bakken Shale exceeds 100 mg/g, thereby occupying most of the sorptive sites in the organic matter, meaning free oil in Rock-Eval S1 is largely movable oil.[34] Measured Ro data were 0.40% lowered by the presence of solid bitumen and oil. Despite this low thermal maturity, the upper Bakken Shale is highly oil saturated, with OSI values averaging about 80 mg/g in the 2-36H-Parshall well, and exhibiting occasional oil crossover. This suggests earlier than expected oil generation and active expulsion. However, biomarker data of the Parshall field oils suggest a slightly higher thermal maturity for the oils of about 0.70% Roe, whereas the upper Bakken Shale extracts have biomarker-derived maturity values that are lower, approximately 0.50 to 0.60% Roe, thereby implying oil migration from more thermally mature areas of the Bakken Shale to the west of the Parshall field.
Although biomarker data suggest migration, light hydrocarbon data (n-C6 and n-C7 and isomers) in the Bakken Shale show some geochemical traits that are similar to produced oil, suggesting that some localized upper Bakken Shale-sourced oil is being produced along with slightly more mature oil.[34] In fact, the distribution of light hydrocarbons correlates closely to oils produced from Lodgepole Mound oils in Stark County, North Dakota, that are among the lowest maturity Bakken Shale-sourced oils.[35] The GOR values at the Parshall field are quite low, approximately 71.2 m3/m3 (400 scf/bbl), whereas nearby Sanish field oils are approximately 142.5 m3/m3 (800 scf/bbl). However, both oils are about 42deg API. The GOR values calculated from rock extract fingerprints using the oil-derived formulation of Mango and Jarvie[36] measured on the upper Bakken Shale rock extracts average 68.4 m3/m3 (384 scf/bbl) for the Parshall field and about 155.3 m3/m3 (872 scf/bbl) for the Sanish field, agreeing with reported values for the produced oils.[37] These data suggest a very localized source.
Published data tables from the North Dakota Geological Survey (2008) show the oil crossover effect in samples from the Middle Bakken and Three Forks Formation (Figure 6A, B). As previously shown by Price et al.,[38] the reduction of hydrogen indices in the hotter parts of the basin is indicative of generation and expulsion. The whereabouts of the charge was uncertain, but the oil crossover effect in panels A and B of Figure 6 shows that a lot of oil was charged into the Middle Member and Three Forks formations. Only a few upper and lower Bakken shales show the oil crossover effect, with typical values between 20 and 70 mg oil/g TOC indicative of residual oil saturation after expulsion.
A geochemical log of the productive EOG Resources 1-05H NampD well in Mountrail County, North Dakota, provides insights into the Parshall field discoveries (Figure 7). This well flowed 204 m3/day (1285 bbl/day) of oil, 11,440 m3/day (404 mcf/day) of gas, and 240 m3/day (1511 bbl/day) of water. The GOR was 55.9 m3/m3 (314 scf/bbl). The GOR values from cuttings have a calculated GOR of 84.2 m3/m3 (473 scf/bbl), indicating sufficient maturity in the upper Bakken Shale to have generated these oils.[34]
The TOC values are high in the upper Bakken Shale, averaging 14.3%, with values ranging between 5.36 and 21.40%, and they are just slightly higher in the lower Bakken Shale at 15.17%, with a range from 8.87 to 24.7%. Carbonate contents in the upper and lower Bakken Shale average 10 and 6%, respectively. The carbonate-rich Scallion above the upper Bakken Shale and Middle Member are readily recognizable, with their high carbonate and low TOC contents. Similar results are found in the Three Forks Formation underlying the lower Bakken Shale. The carbonate content in the Middle Member of the Bakken Formation is primarily dolomite and averages approximately 38%, with a range between 21 and 70%.
Continuous oil crossover is present in both the Scallion and Middle Member, with the Middle Member being the principal reservoir that is now drilled horizontally. Although a particular zone in the Middle Member, for example, the B zone,[39] is preferred by operators, the entire Middle Member is highly oil saturated. Absolute oil contents average about 0.00747 m3/m3 (58 bbl/ac-ft) in the Middle Member, whereas the Scallion has a much lower average of 0.00141 m3/m3 (11 bbl/ac-ft). Both of these values are based on absolute oil (S1) yields, and based on a comparison of rock extracts with produced oil, a substantial loss of hydrocarbons is evident in the rock extracts, with minimal C15- measured by gas chromatography.[34] The upper Bakken Shale has a fingerprint nearly identical to the oil, whereas the Middle Member fingerprint looks like a topped (evaporated) oil.[34] This illustrates an important difference between the organic-rich shales and the carbonates, as all samples were core chips taken at the same time. The organic-rich shale retains even light hydrocarbons from C5 to C10, whereas the organic-lean carbonate appears as a C15+ extract fingerprint with loss of light ends. The difference is not primarily caused by permeability differences, but retention (sorption) by the organic-rich mudstones of the Bakken shales. Although the Bakken Shale-oil yields (S1) are much higher than the Scallion and Middle Member free oil contents due to much evaporative loss, only a part of the oil in the shale would be producible, i.e., only excess oil exceeding the adsorption index (AI).
In addition, the high remaining generation potentials (Rock-Eval S2) in the Scallion and Middle Member are not kerogen content, but instead oil that has carried over into the pyrolysis (S2) yield. This is also noted by the lower equivalent Ro values in the Scallion and Middle Member data. Addition of this carryover oil to the free oil gives the total oil.
The Bakken shales have intermittent oil crossover indicative of active generation and expulsion. Extracts of the Bakken Shale yield CTemp values[40][41] of about 105degC (221degF), suggesting generation at lower than expected temperatures indicative of labile organofacies.[34] Other compositional kinetic data on the Bakken Shale suggests that one organofacies of the Bakken Shale can generate oil at lower thermal maturity and relates to Tmax values just above 420degC (788degF) with 10% conversion at a Tmax of 427degC (801degF).[42]
Lower Cretaceous Niobrara Shale-oil System, Denver Basin[edit]

A shale-oil resource system with characteristics similar to the Bakken shale-oil resource system is the Lower Cretaceous Niobrara Formation of the Denver-Julesberg Basin, often referred to simply as the Denver Basin. A key difference between the two systems is an average TOCo of approximately 2.69% for the source rock intervals in the Niobrara Shale versus about 14.7% for the upper Bakken Shale at Parshall field. The relative hydrogen contents are quite different also, with HIo values about 345 mg HC/g TOC for the Niobrara Shale and more than 700 mg HC/g TOC for the upper and lower Bakken Shale in the Parshall field area.
However, the Niobrara Formation includes not only good organic-rich mudstones, but also interbedded organic-lean carbonates, typically referred to as the Niobrara A, B, and C carbonates, with the B carbonate being the primary production zone.
Data from core chips of the Golden Buckeye Petroleum 2-Gill Land Associates well demonstrate this vastly different TOC content[43] (Figure 8). This well flowed 20.7 m3 (130 bbl/day) of oil and 7220.8 m3 (255 mcf/day) of gas, with only 1.11 m3 (7 bbl/day) of water from the Niobrara B interval. The GOR is reported at 308.1 m3/m3 (1730 scf/bbl). The thesis by Tanck[43] did not include carbonate carbon data, although calcite content is reported to be 84% at 2066.2 m (6779 ft). The productive Niobrara B is found in the 2054.3 to 2065.0 m (6740 to 6775 ft) interval, where oil crossover exists (Figure 8). Oil saturations range from 63 to 80% of pore volume, with porosities of approximately 5 to 6% in this interval.[43] A deeper zone at 2075.7 to 2080.3 m (6810–6825 ft) has similarly high oil saturations, but much lower porosities in the 3 to 4% range.[43]
The shale intervals are more organic rich and have higher oil contents indicative of source rocks that have generated hydrocarbons. In general, however, the higher the TOC, the lower is the oil crossover. Porosities are also lower in the shale, typically in the range of 2 to 3%.[43]
The % Roe data from Tmax suggest a consistent trend over the 240 ft (73 m) interval reported. The Tmax increases from about 435 to 450degC (815 to 842degF) or 0.67 to 0.95% Roe. This is indicative of a very high paleogeothermal gradient, suggesting a very high heat flux. Zones with low Tmax values are oil-saturated carbonates, and those Tmax values are derived from oil, not kerogen.
A key well completed in the Denver Basin in September 2009 was the EOG Resources 2-01H-Jake in Hereford field, Weld County, Colorado, that had an initial production (IP) flow rate of 254 m3 (1600 bbl) of oil. As of August 31, 2010, this well had produced 12,496 m3 (78,599 bbl) of oil, 1.34 times 106 m3 (47,334 mcf) of gas, and 3371 m3 (21,201 bbl) of water, with an average GOR for 11 months of production of 116.8 m3/m3 (656 scf/bbl).[44]
Niobrara Shale activity is ongoing in a number of other Rocky Mountain basins, as well as the Powder River, Wind River, Washakie, Sand Wash, Piceance, and Park basins.
Mississippian Barnett Shale-oil System, Fort Worth Basin[edit]

The Barnett Shale has produced limited amounts of oil since the 1980s. Certainly much conventional production in the Fort Worth Basin has been sourced by the Barnett Shale, as substantiated by Hill et al.[45]
Most of the Barnett Shale oil has been recovered in vertical wells in the oil window parts of the basin, that is, western and northern parts of the Fort Worth Basin. The Barnett Shale is thinner in the west but thickens toward the northeast and is less mature in both locations, with vitrinite reflectance values of about 0.60% Roe in Brown County in the far southwestern part of the basin and about 0.85% Roe in the north-northeastern parts of the basin, for example, Clay, Montague, and Cooke counties, Texas. Oil produced from a well in the southwest, the Explo Oil 3-Mitcham, yielded a 36deg API from the Barnett Shale at 0.60% Roe. Typical of marine shale source rocks, oils are 35deg API and higher, even at low thermal maturities.
Recent production is from the Barnett Shale itself, that is, a mudstone-dominated system with high quartz content. A critical assessment of this mudstone oil reservoir suggests that the organic-rich mudstone with high clay and quartz content and low carbonate content inhibits production of oil because of its organic richness (5–8% TOC in these areas). Storage porosity is also minimal with oil in nanopores associated with organic matter and matrix porosity.[1] Although biogenic silica yields are abundant, averaging upward of 40%, the close association of this biogenic silica with organic matter tends to inhibit flow of oil due not only to low permeability, but also the sorption of more polar components of oil to organic matter. Barnett Shale black oil tends to have a much broader range of petroleum present, as shown by Jarvie et al.,[46] so both molecular size and the presence of polar compounds in the oil, as well as minimal porosity and especially low permeability in the shale, all combine to inhibit flow from this reservoir.
Before the recent surge in pursuit of shale-oil resource systems, a vertical well drilled by Four Sevens Oil Co. in Clay County, northwestern Fort Worth Basin, had an initial production of about 32 m3/day (200 bbl/day).[47] A geochemical log of this well shows oil crossover in the lower half of the Barnett Shale with a very low carbonate content (Figure 9). The Pennsylvanian Marble Falls lies conformably on top of the Barnett Shale, with TOC values less than 1.00% and with high carbonate contents between 50 and 75 wt. %. Compare this carbonate with that of the Middle Member of the Bakken Formation, and it is readily apparent that both the TOC and oil saturation are low. Thus, it is not just a matter of low TOC values in carbonates providing the low threshold to oil saturation as indicated by OSI, but the necessity of emplaced oil. As the TOC increases into the upper Barnett Shale, the carbonate content decreases. The average carbonate content in the Barnett Shale is 11 wt. %. From vitrinite equivalency based on a Tmax of about 0.80% Roe and HIs in the 280 mg/g range or about 35% conversion, the Barnett Shale is in the main phase of oil generation in this locale.
The free oil content (S1) increases in the lowermost Barnett Shale exceeding TOC and shows oil crossover, whereas the upper Barnett Shale does not. However, such oil crossover with low porosity and permeability in an organic-rich, carbonate-poor rock will not readily flow black oil. The retained oil averages about 0.0155 m3/m3 (120 bbl /ac-ft) or a computed OIP based on average oil yields (S1) of 2.36 times 106 m3/km2 (38.5 million bbl/mi2) using 500 ft (152 m) of shale thickness without any correction for evaporate and handling losses to S1 yields. Although this vertical well flowed oil, the rate declined quickly, indicative of the problem of extracting oil from a tight mudstone with a low carbonate content and no known open fractures.
The presence of reasonable to high amounts of silica, in this case biogenically derived and associated with organic matter, does not impact shale-oil resource systems the way it does shale-gas resource systems at least in those successes to date. Comparison of the Bakken and Niobrara with the Barnett Shale-oil resource system oil rates and recoveries demonstrates the importance of carbonates in shale-oil resource systems.
More recently, vertical wells drilled by EOG Resources have had IPs of 48, 103, 70, 159, and 72 m3/day (300, 650, 440, 1000, and 450 bbl/day) of oil flow, with gas flow of 2832, 11,327, 19,822, 56,634, and 19,822 m3/day (100, 400, 700, 2,000, and 700 mcf/day), respectively, which they refer to as their combo Barnett Shale play.[1] These wells are located in Cooke and Montague counties, Texas, in the north and northeastern areas of the Fort Worth Basin. As shown by their argon ion-milled scanning electron microscope micrographs from western Cooke County, virtually no organic porosity exists, but matrix porosity was 2 to 3%, with pore throats of 4000 to 7000 nm[1] or about 100 times greater than those found in the core gas-producing areas of the Barnett Shale. In Cooke County, northeastern Fort Worth Basin toward the Muenster arch, the Barnett Shale thickens to more than 213.4 m (700 ft) and becomes enriched in carbonate. In this area, debris flows have been inferred from core observations.[48] However, in western Montague County, Texas, EOG Resources reports pore throats of 4 to 50 nm, thereby making a more challenging production area despite a high quartz content and being in the oil window.
EOG Resources estimates that approximately 1.11 times 107 m3 (70 million bbl) of oil and 4.96 times 109 (175 billion ft3) of gas in place per 2.59 km2 (0.9 mi2) exist in their Barnett Shale acreage in eastern Montague and western Cooke counties, Texas.[49] In the best oil-producing area of the Barnett Shale, EOG's average initial production rates are 39.7 to 159.0 m3 (250–1000 bbl) of oil, 20.7 m3 (130 bbl) of gas liquids per million ft3 of gas, and 2.83–5.66 times 104 (1–2 million ft3) of gas/day. They drill both vertical and horizontal wells with 0.081 km2 (20 ac) or tighter spacing on the former as the Barnett Shale is between 213.3 and 457.2 m (700–1500 ft) thick as it approaches the Muenster arch in the northeastern part of the Fort Worth Basin.
Eagle Ford Shale, Austin Chalk Trend, Texas[edit]
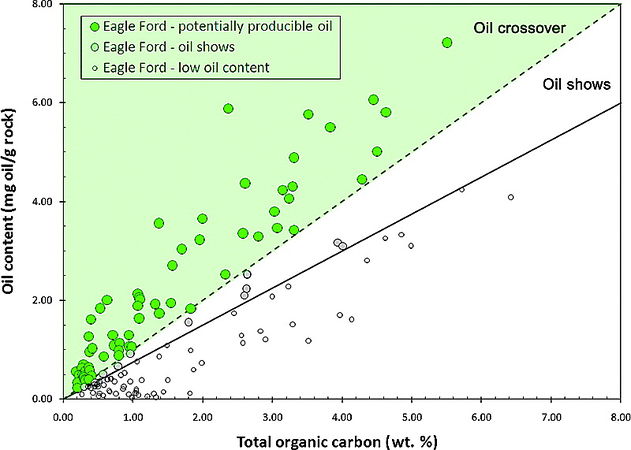
Figure 10 Geochemical database of Eagle Ford Shale showing the oil crossover effect.
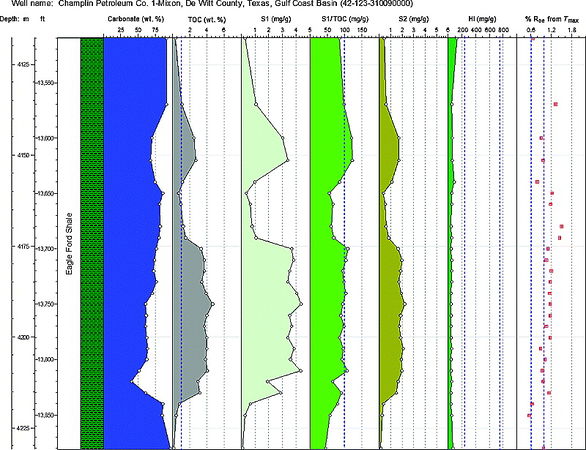
Figure 11 Champlin Petroleum Co. 1-Mixon well geochemical log showing the oil crossover in the 13,570 to 13,630 ft (4136 to 4154 m) interval, with intermittent crossover in deeper intervals. Note the extremely high carbonate content of the Eagle Ford Shale. TOC = total organic carbon; S1 = Rock-Eval measured oil contents; S2 = Rock-Eval measured kerogen yields; H = hydrogen index.
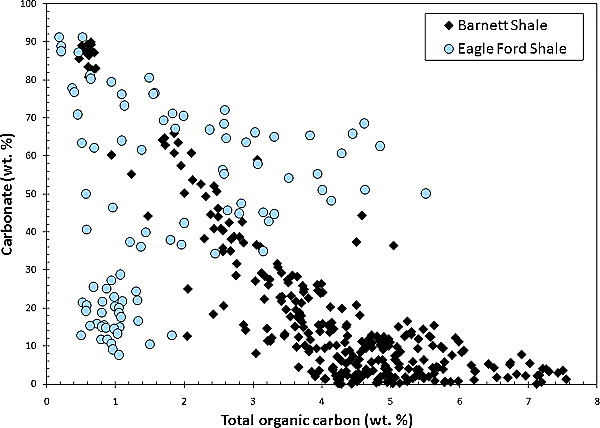
Figure 12 Organic and carbonate carbon comparison in the Barnett and Eagle Ford shales. As total organic carbon (TOC) increases in the Barnett Shale, carbonate content decreases. In the Eagle Ford Shale, the organic-rich intervals typically have 30 to 70% carbonate contents.


The Upper Cretaceous Eagle Ford Shale is the source of Austin Chalk-produced oils[50] along a trend running from central northeastern Texas to south Texas counties bordering Mexico (no. 24 in Appendix immediately following this chapter, Figure 1, shale resource systems in North America). The Eagle Ford Shale averages about 3.7 to 4.5% TOC, with an original HI of about 414 mg HC/g TOC,[50] although immature roadcuts in Val Verde County, Texas, have HI values more than 600 mg/g.[51] Grabowski[50] also estimates oil yields to be about 0.0515 m3/m3 (400 bbl/ac-ft), with values as high as 0.1547 m3/m3 (1200 bbl/ac-ft). EOG Resources currently estimates the Eagle Ford Shale play as having 1.43 times 108 m3 (900 million BOE) in their lease areas alone.[1]
A geochemical database of Eagle Ford Shale demonstrates that many samples show oil crossover[52] (Figure 10). A geochemical log of the Champlin Petroleum Co. 1-Mixon well in De Witt County, Texas, illustrates what is commonly seen in wells along the Austin Chalk trend (Figure 11). This mudstone shale-gas/shale-oil resource system contains about 60% carbonate content on average. Thus, the Eagle Ford may be more aptly described as a calcareous shale or argillaceous lime mudstone.[53] The lean TOC interval from 2475 to 2510 m (8120–8235 ft) is the Austin Chalk, which shows intermittent oil crossover. The Austin Chalk is productive along this trend, and such productive zones are readily identifiable by the oil crossover effect. The Eagle Ford Shale is present below 2511.5 m (8240 ft), and the TOC increases to a high of just less than 6.00%, with carbonate contents remaining very high. Intermittent, but consistent, oil crossover occurs in various intervals of this well, for example, 2523.7 to 2542.0 m (8280–8340 ft) and especially 2546.6 to 2572.5 m (8355–8440 ft). This geochemical log is typical of almost all wells along this trend that are in the oil or early wet gas window.
Some oil carryover into the remaining generation potential (Rock-Eval S2 peak) likely occurs but not sufficient to affect Tmax to any substantial amount. The Tmax values range from 440 to 450degC (824 to 842degF) (or sim0.75 to 0.95% Roe), placing the Eagle Ford Shale in this well in the peak oil-generation window.
In the Barnett Shale, as TOC increases, carbonate carbon content generally decreases (Figure 12). However, the Lower Cretaceous Eagle Ford Shale shows no particular trend, with high TOC Eagle Ford Shale samples having ample carbonate content in this data set ranging from about 30 to 70%, whereas organic-lean intervals show both high and very low carbonate contents.
The Eagle Ford Shale-oil resource system may be an ideal case to study the impact of CO2 and organic acid generation because of the intimate association of carbonates with organic matter.
Other United States Shale-oil Resource Plays[edit]

Mowry Shale, Powder River Basin[edit]
In the Powder River Basin, there has been success in producing oil from the Lower Cretaceous Mowry Shale.[44] The EOG Resources 1-16H-Trans Am well was reported to have flowed 3.2 m3/day (20 bbl/day) of oil, 8.5 times 104 m3/day (30,000 ft3/day) of gas, and 51.7 m3/day (325 bbl/day) of water.[44] After 6 months of production, the well had produced 1023 m3/day (6436 bbl/day) of oil, 4.02 times 105 m3/day (14.2 million ft3/day) of gas, and 310.5 m3/day (1953 bbl/day) of water. The horizontal length was about 1167.08 m (3829 ft) with 14 hydraulic fracturing stages completed. Stimulation of various zones ranged from 3.18 times 102 to 3.18 times 103 m3 (2000–20,000 bbl) of slick water, with about 2.1772 times 104 to 1.81437 times 105 kg (48,000–400,000 lb) of 841/420 mum (20/40 mesh) and 149 mum (100 mesh) sand (scout ticket). The Mowry Shale is at about 2621.28 m (8600 ft) in this area.
The present-day TOC (TOCpd) values for the Mowry Shale only average 1.95%, with an estimated original TOC (TOCo) of 2.43%. The original hydrogen index (HIo) values average about 183 mg HC/g TOC, with a range from 128 to 400 mg/g. Based on the expulsion curves of Pepper[20] based on original hydrogen index (HIo) values, such a system will expel between 0 and 50% of its generated products and, therefore, should retain a high percentage of generated products. At higher thermal maturities, peak to late oil window, the oil quality should be condensate-like in terms of API gravity. Oil crossover effect is noted in various intervals in Mowry Shale wells, but also in the underlying Muddy Formation sands that are produced as conventional reservoirs.
A geochemical log of the Home Petroleum 2-Phoenix Unit in Johnson County, Wyoming, shows oil crossover in the Mowry Shale at 3478.51 m (11,412.4 ft) (Figure 13). The oil yield is reasonably high in this interval of 17.7 m (58 ft). This computes to about 2.385 times 105 m3/2.589988 km2 (1,500,000 bbl/mi2) using unadjusted S1 values.
Cody and Mowry Shales, Bighorn Basin[edit]

There is no announced discovery of a shale-oil resource system in the Mowry Shale of the Bighorn basin, although it is speculated to be a potential shale-oil resource system much as in the Powder River Basin. An example for potential production is given by the Gulf Exploration Corp. 1-31-3D-Predicament well in Big Horn County, Wyoming. A geochemical log demonstrates oil crossover in the Cody and Mowry shales, with high amounts of oil particularly in the Cody Shale (Figure 14). The Cody Shale shows more than 580 m (1900 ft) of oil crossover suggestive of more than 3.56 times 106 m3/km2 (106 million bbl/mi2) of oil (uncorrected for evaporative losses). At this depth with the high OSI values, it is anticipated that this is open-fractured Cody Shale. Oil also exists in the overlying Eagle Formation sands. Calculated TOCo values range from 2.05 to 4.31%, with HIo values ranging from 78 to 642 mg HC/g TOC. The highest value is a bit anomalous compared with the other five samples of the Cody Shale that only range from 1.94 to 2.65% TOCo and 78 to 284 mg HC/g TOC for HIo.
Oil crossover is apparent in the Mowry Shale and Muddy Formation at 3753.6 m (12,315 ft) and 3799.3 to 3826.7 m (12,465–12,555 ft).
The Mowry Shale shows fair to good source rock characteristics given the thermal maturity of about 0.90% Roe; HIo is estimated to be about 130 to 300 mg HC/g TOC, with TOCo estimated to range from about 1.54 to 4.66% (although the higher TOC sample has the lower HIo of 130 mg HC/g TOC). Carbonate carbon data are not available on any sample.
Paradox Basin[edit]

Various shales in the Paradox Basin have been completed for shale gas, but as in many basins, an oil window play is also available for a shale-oil resource system(s) play. In fact, the Pennsylvanian Cane Creek Shale of the Paradox Basin first produced 6264 m3 (39,393 bbl) of oil from the 5-Big Flat vertical well in 1961 in what became the Bartlett Flat field.[54] The only true commercial success from a vertical well came with the 1-Long Canyon that is estimated to have produced 159,000 m3 (1 million bbl) of oil and 3 times 107 m3 (1 billion ft3) of gas.[54]
A short horizontal well drilled by Columbia Gas Development Corp. in 1991, the 27-1-Kane Springs Federal, flowed 145 m3 (914 bbl) of oil and 8200 m3 (290 mcf) of gas over the Cane Creek Shale interval from 2267 to 2512 m (7438–8240 ft), with a pressure gradient of 19.2 kPa/m (0.85 psi/ft).[54]
A well drilled in 2009 by Whiting Oil & Gas Corp., the 43-18H-Threemile in San Juan County, Utah, in the Cane Creek Shale was reported to have 8 to 13% porosity, 10 to 50 microdarcys permeability, and 20 to 35% water saturation; and was highly overpressured with a pressure gradient of 21.218 kPa/m (0.938 psi/ft).[55] The well was completed with an uncemented liner and swell packers with 11-stage stimulation every 152.4 m (500 ft), each with 49,895.16 kg (110,000 lb) of proppant and 318 m3 (2000 bbl) of gel.[55] The scout ticket shows an initial flow rate of 1.145 m3/day (72 bbl/day) of oil, 1080 m3/day (38 mcf/day) of gas, and 31.16 m3/day (196 bbl/day) of water, but the well has since produced 1722 m3 (10,832 bbl) of oil, 5.16 times 104 m3 (1821 mcf) of gas, and 8863 m3 (55,745 bbl) of water, with a maximum GOR of 134.83 m3/m3 (757 scf/bbl).[44]
An example of the Pennsylvanian Cane Creek section is provided by a geochemical log of the Mobil Oil Corp. 12-3-Jakeys Ridge well (Figure 15). These data illustrate the high organic carbon content throughout this 755.9 m (5760.81 ft) interval of the Cane Creek Shale, with an overall average of 7.67%. However, four distinct intervals are present, with average TOC values over the uppermost interval of 67 m (219.81 ft) with 1.34%, 146.3 m (479.98 ft) of 4.91%, 231.7 m (701.11 ft) of 13.49%, and 42.7 m (140.09 ft) of 6.61%. Although extremely high oil contents (S1) are present in the organic-rich interval, the values only exceed 100 mg/g at 2315.5 m (7596.76 ft), whereas the uppermost lean zone in this well has the highest OSI values averaging 120 mg/g over 67 m (219.81 ft). Thermal maturity is middle oil window based on the % Roe from Tmax measurements. The present-day hydrogen index (HIpd) values are low given this level of thermal maturity, suggesting either high-level conversion at this thermal maturity or lower than expected HIo values. The HIo values are estimated to have been 123, 265, 475, and 356 mg/g for the four different organic richness zones previously described.
Cretaceous Tuscaloosa Marine Shale, Louisiana[edit]

The Lower Cretaceous Tuscaloosa Marine Shale (TMS) ranges in thickness from 152.4 m (500 ft) to more than 243.8 m (800 ft) overlain and underlain by sands. The depth to the TMS is found at 3048 m (10,000 ft) and deeper. One well, the Texas Pacific Oil Co. 1-Winfred Blades, in Tangipahoa Parish, Louisiana, produced more than 3180 m3 (20,000 bbl) of oil from perforations in the TMS between 3375 and 3549 m (11,073–11,644 ft).[56]
Encore Acquisition, purchased by Denbury in 2010, drilled wells to test the shale-oil resource system of the Tuscaloosa Shale. The Encore Operating 4-13H-Jackson Joe well was drilled to about 46,811.7 m (15,650 ft) in Amite County, Mississippi. The well had a lateral of 502.9 (1650 ft) that was stimulated in three stages with 711 m3 (4471 bbl) of X-LinkGel and placed on pump (scout ticket). The TMS had an initial production rate of 114 m3 (175 bbl/day) over the interval from 4087.4 to 4092.2 m (13,410–13,426 ft).
Limited data are available on the TMS, but an article by Miranda and Walters[57] provides detailed analyses of an upper-middle Tuscaloosa Shale core. Sun Oil Corp. drilled the 1-Spinks well in Pike County, Mississippi, taking 94.5 m (310 ft) of core. They report the core as having dark-gray fissile shale with occasional thin (5–25 cm [2–10 in.]) sand intervals. The well was perforated in three different intervals between 3356.15 and 3366.21 m (11,011–11,044 ft), but no oil or gas flow was recorded.
A geochemical log of this well illustrates the extremely low carbonate and organic carbon contents, low OSI values, and about 1 to 2% sulfur throughout the sampled interval (Figure 16). The TOCpd values average only 0.84% with a range of 0.21 to 1.36%. Miranda and Walters[57] estimate about 20% conversion of organic matter. As such, TOCo values would only increase to about 0.92% or a range of 0.25 to 1.60%. The HIo values are estimated to be on the low end of marine shales at 284 mg HC/g TOC on average with a range of 150 to 402 mg HC/g TOC. Not only is the Tuscaloosa organic lean, but it also has extremely low carbonate (sim1%) and about 2% sulfur contents. The conversion of pyrolysis yields to oil would yield about 7.27 times 104 m3 (1.184 million bbl/mi2). Over the 15,280.93 km2 (5900 mi2) of Tuscaloosa deposition, this would amount to just about 1.11 times 109 m3 (7 billion bbl) of oil equivalent with a very high retention of generated oil based on the low HIo values, as previously predicted by John et al.[56] The issue is not with this estimate, but being able to recover even a minimal percentage of this volume of oil. Such a low carbonate shale-oil resource system will be one of the most difficult systems to stimulate and achieve good and enduring oil flow. However, it should be noted that the clay and quartz contents are not known. Based on the organic matter, Tuscaloosa sourced oil would be a high API gravity oil or condensate, but with sulfur present. The better likelihood for production is the closely associated sands. This type of system remains a significant challenge to developing similar unconventional shale-oil plays.
Heath Shale[edit]

The Upper Mississippian Heath Shale in the Central Montana trough is a candidate shale-oil resource system. This system is a fractured shale-oil play with higher porosity and some vertical wells have flowed 200 bbl/day.[58]
The TOC data from Cella and Drozd[59] show an average TOC of 7.6% on 32 core samples from Fergus County, Montana, although the authors state that the thickness of the source rock is less than 10 m (20–30 ft), with calcareous shales being the best source rock intervals. They also state that “a large part of generated hydrocarbons remained within the source rock interval” (p. 382). Thermal maturity values range from immature to late oil window primarily in parts of Musselshell, Rosebud, and Garfield counties.[59]
The Continental 1-Staunton well illustrates the variability in various geochemical characteristics of the Heath Shale. (Figure 17). The average TOC value is 4.52% in this well, but the range is 0.20 to 13.66% with a high standard deviation of 5.20%. Carbonate carbon data are not available. The pyrolysis yields (present-day Rock-Eval measured kerogen [S2pd]) and HIpd are also highly variable, with HIpd values averaging 315 mg HC/g TOC, with a range of 137 to 523 mg HC/g TOC. Thermal maturity is early oil window with % Roe from Tmax values of 0.51 to 0.72%. Conversion of organic matter is thus likely about 10 to 20%.
The oil crossover effect is noted in two samples: one at 778.76 m (2555 ft) and another at the base, 815.34 m (2675 ft); both are organic lean with 0.41% and 0.20% TOC, respectively, characteristic of hybrid shale-oil resource systems, and these may be the zones to target in future drilling efforts.
Marcellus and Utica Shales[edit]

The Devonian Marcellus Shale is regarded as becoming the largest shale-gas resource system in the United States, but areas are also present in western New York and West Virginia where the shale is in the oil window. Wells in these areas show the oil crossover effect. Data from the State Museum of New York show OSI values more than 100 mg oil/g TOC in Erie, Livingston, Allegany, Chautauqua, and Otsego counties and also to the south in northwestern West Virginia.[60]
Similarly, the Ordovician Utica Shale shows oil crossover in parts of New York, Pennsylvania, Ohio, and Michigan.
A plot of TOC versus oil for both Marcellus and Utica shales shows the crossover effect even in areas where the shales show a high level of conversion indicative of gas window thermal maturity (Figure 18). This could be contamination or migrated oil.
Permian Basin[edit]
Wolfcamp Shale[edit]
The Lower Wolfcamp Shale is being pursued for its shale-oil resource potential.[61] Vertical wells drilled by Pioneer Natural Resources Co. are reported to average 2 to 10 m3 (15–60 bbl/day) in 61.0 to 91.5 m (200–300 ft) of shale, with TOC values reported as very high.[61] Lower Wolfcamp Shale near the Horseshoe Atoll in Borden County, Texas, averages about 2.99% on cuttings, with thermal maturity in the early oil window; the TOCo is estimated to be 3.82% on average, with values over a broad range from 1 to 10%. Horizontal wells with approximately 1219.2 to 1524.0 m (4000 to 5000 ft) laterals with 14 hydraulic fracturing stages are anticipated.[61] This hybrid shale-oil resource play is often referred to as the Wolfberry play for the juxtaposition of Wolfcamp shales and Spraberry sands.
Bone Springs and Avalon Shale[edit]
Age-equivalent (Leonardian) Bone Springs and Avalon shales are found primarily in the Permian Basin in New Mexico but extend into central western Texas. This system represents a hybrid shale-oil resource system with organic-rich carbonate source rocks interbedded with sands and silts with a thickness of about 1066.8 m (3500 ft) and porosities ranging from 0 to 20% predominantly at about 10%. Depth to this resource system ranges from 1981.2 to 2743.2 m (6500–9000 ft). Geochemical data collected on the Bone Springs Shale show a TOCpd range of 2.09 to 6.98% at about 50% conversion,[62] suggesting TOCo values of 2.79 to 9.31%. Carbonate contents span the full gamut of values ranging from as low as 5% to 100%. Oil crossover is noted in various Bone Springs and Avalon argillaceous lime mudstone intervals.
Chesapeake Energy Corp. predicts that its Avalon Shale play will yield about 5.406 times 107 m3 (340 million) barrels of oil equivalent (BOE), whereas EOG Resources projects that its properties have a resource potential of about 1.033 times 107 m3 (65 million) BOE. Devon Energy Corp.'s best Avalon Shale wells have had initial production rates of more than 79 m3/day (500 bbl/day) of condensate, 79 m3/day (500 bbl/day) of natural gas liquids (NGL), and 8.5 to 1.41 times 104 m3/day (3–5 mmcf/day) of gas.
Additional argillaceous lime mudstones with source rock potential in the Permian System include the Guadalupian Cherry Canyon Shale that averages 2.92%, with some intervals averaging 4.80%.[62] The Bell Canyon Shale has TOCpd values from 1.22 to 4.56% at an estimated 50% conversion, implying a TOCo range of 1.63 to 6.08%.[62] Both of these rocks show the oil crossover effect in various areas of the Permian Basin.
International shale-oil plays[edit]

Western Canada Sedimentary Basin[edit]
Although the Doig Phosphate and Montney Shale are discussed as a shale-gas resource system, they can also produce substantial liquid petroleum depending on the location. What is interesting about the Montney Shale is the overridingly low TOC values reported, suggesting it as only a poor to fair source rock (see part 1 of this chapter). Furthermore, Riediger et al.[63] correlate several known oil accumulations in the Montney Formation to be sourced by either the Doig Phosphate or the Jurassic Nordegg Formation. Regardless, both gas and oil production is ongoing in the Montney Formation, and it can be described in a variety of ways as a tight resource system with petroleum sourced internally by more organic-rich Montney Shale or by secondary migration from the overlying Doig Phosphate, or by tertiary migration from the Nordegg Formation.
A database of Montney Shale wells was obtained from the Geological Survey of Canada.[37] This database consists of data from 24 wells with 192 Montney Shale samples. Average TOCpd is 1.02% over a range of 0.25 to 4.79%, with a standard deviation of 0.70% indicative of a much lower TOC value overall than most of the shale resource plays, except for perhaps the Lewis Shale of the San Juan Basin, New Mexico. Calculated HIo values are highly variable, ranging from less than 100 mg HC/g TOC to upward of 700 mg HC/g TOC. However, the very high HIo samples account for only 8% of the database with more than 70% at values less than 100 mg HC/g TOC. Some sourcing of petroleum by the Montney Shale occurs, but it does not appear to have the petroleum-generation potential to have sourced the high amounts of gas and oil in the Montney Formation.
Of these 192 samples, 16 samples from five different wells showed oil crossover (Figure 19). The production of gas from the Montney Shale can be restricted by the presence of oil in the system that tends to reduce gas flow rates. However, shale-oil resource potential exists, given the high amount of oil crossover in these data.
West Siberian Basin[edit]
An open-fractured shale-oil resource system is the Upper Jurassic Bazhenov Shale of the intracratonic West Siberian Basin.[18] The Bazhenov Shale is a marine type II kerogen that is the primary source rock in the West Siberian Basin, with TOC values ranging from 5 to 35%, typically exceeding 15%.[18] Production rates of 50 to 1700 m3/well (315–10,700 bbl/well) have been achieved from this system, which is mostly governed by identification of highly fractured shale with 10 to 12% porosity that still requires stimulation.[18] Intervals dominated by siliceous or carbonate lithologies have the best reservoir properties, with 10 to 12% porosity and permeabilities typically less than 0.01 md.[18]
As shown in Figure 2, oil crossover occurs in the geochemical logs of the 11-18-Maslikhov well. In the interval from approximately 2904 to 2916 m (sim9527–9567 ft), oil crossover is very high, suggestive of high free oil content in open-fractured shale (instead of tight shale, although the 2909 m [9543.9 ft] sample is not likely fractured). As stated by Lopatin et al.,[18] the production risk is primarily controlled by thermal maturity and fractures in the shale.
Paris Basin, France[edit]
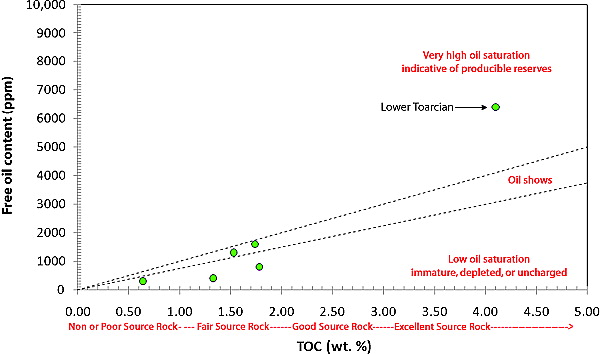
Figure 20 The oil crossover effect in the Toarcian Shale, Paris Basin, France. Data from Espitalie et al.[64] TOC = total organic carbon.
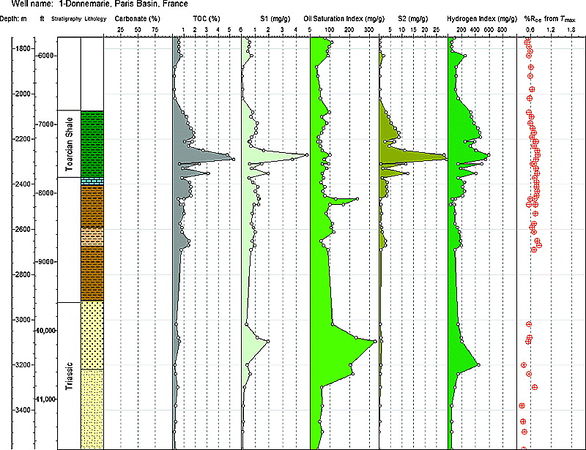
Figure 21 Geochemical log of the 1-Donnemarie well, Paris Basin, France. The oil crossover is apparent just below the organic-rich Toarcian Shale and also in a conventional Triassic sandstone reservoir that has been produced for about 20 yr. TOC = total organic carbon; S1 = Rock-Eval measured oil contents; S2 = Rock-Eval measured kerogen yields.


Recently, the Paris Basin of France is described as having shale-oil resource potential.[65] Substantiating this, it has been recently announced that Vermillion Energy has achieved oil flow of 32 to 38deg API oil in Paris Basin Toarcian Shale.[66] The company reported porosity as high as 12%.
Average Toarcian Shale data from Espitalie et al.[64] demonstrate the oil crossover effect (Figure 20). Furthermore, a geochemical log of a well from the Donnemarie field was constructed to illustrate the shale-oil system play (Figure 21). This log illustrates two reservoir systems: one proven conventional and an unproven unconventional. The oil crossover effect in this well is obvious between 3020 and 3240 m (sim9908–10,630 ft), where conventional Triassic sandstone production exists. Uphole from this conventional ongoing production, immediately below the organic-rich Toarcian Shale, a thick organic-lean interval is present in this well from 2465 to 2609 m (sim8087.2–8559.7 ft) where oil crossover occurs, indicative of an untested, but potential, hybrid shale-oil resource production. Given the source rock type, a marine shale, and conventionally produced oil quality elsewhere in the basin, oil in this interval would be expected to be more than 35deg API oil. The Toarcian Shale immediately above this zone of crossover has an average TOC of almost 2.00% and is in the earliest oil window at about 0.75% Roe (from Tmax). In addition, a Toarcian Shale sample at 2270 m (7447.8 ft) is organic rich (4.47% TOC) and exhibits very high oil content and oil crossover indicative of active generation and expulsion. A sample at 2530 m (8300.5 ft) does not show crossover, so it could be a seal between two free oil-saturated zones.
Although carbonate carbon data were not reported on these well samples, it is anticipated that the organic-lean oil crossover zone below the Toarcian Shale is likely carbonate rich based on literature lithofacies descriptions.
Other Worldwide Locales for Shale-oil Resource System Production[edit]
Elsewhere in Europe, there may also be shale-oil potential in various regions that are being explored for shale-gas resource systems. Many of the basins have an oil window as well as a gas window, so the opportunity likely exists in many basins. For example, data from the lower Saxony Basin of Germany, lower Hils syncline, show vitrinite reflectance values ranging from 0.49 to 1.3% Ro.[67] Both the Wealden and Posidonia shales could be potential shale-oil resource systems. Similarly, in one of the hot areas for shale-gas activity, Poland, shale-oil resource potential also exists, given modest levels of conversion of the organic-rich shales in select areas.
With its abundant oil production, the oil-saturated organic-rich source rocks in Saudi Arabia are likely targets. Both the Tuwaiq Mountain and Hadriya Formation, the latter of which is being tested, are likely targets for possible production from shale-oil resource systems.
In Latin America, various organic-rich shales that have sourced conventional oil reservoirs are potential targets for shale-oil resource systems. For example, the La Luna Shale of Colombia is one of the most obvious potential targets. The Upper Jurassic–Lower Cretaceous Vaca Muerta Shale is being pursued for its resource potential in the Neuquin Basin, Argentina. Other source rocks in the Neuquin Basin may also have potential shale-oil resources, such as the Lower to Middle Jurassic Los Molles Shale. A less known system is the Devonian Cordoba Shale of Uruguay. Other marine shale possibilities exist through most of Latin America.
TAG Oil has targeted a shale resource system from the uppermost Paleocene–lowermost Eocene Waipawa Black Shale and Upper Cretaceous–lowermost Paleocene Whangai fractured shale in New Zealand.[68] Permeabilities are typically from 10 to 200 microdarcys with 9 to 31% porosities.[69] The gravity of oils is reported to be 50deg API.[68]
Thus, it is evident that production from not only shale-gas systems, but also shale-oil resource systems, will be a worldwide phenomenon. However, it is unlikely that shale-oil resource systems will have the dramatic impact of shale-gas resources unless knowledge and technologies are developed to extract the tightly retained oil in organic-rich mudstones.
Conclusions[edit]
Shale-oil resource systems are difficult to define and, in some cases, to differentiate from conventional petroleum systems. However, a basic description uses organic richness, fracturing, and facies to classify these systems into three basic types. More important, these types help predict the likelihood of a good recovery from the different types of systems.
Organic matter in source rocks is important for its generation of petroleum and also its retentive capacity. The process of sorption restricts the ability to extract petroleum from organic-rich mudstones, certainly along with their ultra-low permeability. Fracturing and the presence of carbonates, whether internal to the organic-rich mudstone or in juxtaposed, organic-lean rock units, enhance the producibility of petroleum due to their lower sorption effects.
The oil crossover effect is a simple, yet effective, means to identify potential reservoir intervals whether conventional reservoirs or shale-oil resource systems. Oil crossover occurs when the oil content of a rock exceeds the TOC on an absolute basis or when the OSI exceeds 100 mg oil/g TOC. When oil crossover occurs, potentially producible oil is indicated, although no assessment of oil flow rates or oil versus water saturation is provided. When very high oil crossover occurs in organic-rich mudstones, open fractures are indicated. Production of oil from organic-rich mudstones without fractures is limited to the amount of oil exceeding approximately 70 mg oil/g TOC, depending on oil type and quality, lithofacies, and sample handling.
References cited[edit]
- ↑ 1.0 1.1 1.2 1.3 1.4 1.5 EOG Resources, 2010, Investor presentation, 223 p.
- ↑ Welte, D. H., and D. Leythaeuser, 1984, Geological and physicochemical conditions for primary migration of hydrocarbons: Naturwissenschaften, v. 70, p. 133–137, doi:10.1007/BF00401597.
- ↑ Surdam, R. C., L. J. Crossey, E. Sven Hagen, and H. P. Heasler, 1989, Organic-Inorganic interactions and sandstone diagenesis: AAPG Bulletin, v. 73, no. 1, p. 1–23.
- ↑ 4.0 4.1 4.2 Pitman, J. K., L. C. Price, and J. A. LeFever, 2001, Diagenesis and fracture development in the Bakken Formationm Williston Basin: Implications for reservior quality in the Middle Member: U.S. Geological Survey Professional Paper 1653, 19 p.
- ↑ L. C. Price, 1997, personal communication
- ↑ Price, L. C., C. E. Dewitt, and G. Desborough, 1998, Implications of hydrocarbons in carbonaceous metamorphic and hydrothermal ore-deposit rocks as related to hydolytic disproportionation of OM: U.S. Geological Survey Open-File Report 98-758, 127 p.
- ↑ L. Wenger, 2010, personal communication
- ↑ Jarvie, B. M., and D. M. Jarvie, 2007, Thermal decomposition of various carbonates: Kinetics results and geological temperatures of conversion: 23rd International Meeting on Organic Geochemistry (IMOG) 2007, Torquay, UK, September 9–14, 2007, p. 311–312.
- ↑ Gaupp, R., and R. Schoener, 2008, Intrareservoir generation of organic acids and late stage enhanced porosity in sandstones (abs.): AAPG Bulletin Search and Discovery article 90078, AAPG National Convention, San Antonio, Texas.
- ↑ 10.0 10.1 10.2 Sandvik, E. I., W. A. Young, and D. J. Curry, 1992, Expulsion from hydrocarbon sources: The role of organic absorption, Advances in Organic Geochemistry 1991: Organic Geochemistry, v. 19, no. 1–3, p. 77–87, doi:10.1016/0146-6380(92)90028-V.
- ↑ J. Levine, 2010, personal communication
- ↑ Baker, D. R., 1962, Organic geochemistry of Cherokee Group in southeastern Kansas and northeastern Oklahoma: AAPG Bulletin, v. 46, p. 1621–1642.
- ↑ Espitalie, J., M. Madec, and B. Tissot, 1984, Geochemical logging, in K. J. Voorhees, ed., Analytical pyrolysis: Techniques and applications: London, Butterworths, p. 276–304.
- ↑ 14.0 14.1 14.2 Jarvie, D. M., and D. R. Baker, 1984, Application of the Rock-Eval III oil show analyzer to the study of gaseous hydrocarbons in an Oklahoma gas well: 187th ACS National Meeting, St. Louis, Missouri, April 8–13, 1984.
- ↑ Reed, R., and R. Loucks, 2007, Imaging nanoscale pores in the Mississippian Barnett Shale of the northern Fort Worth Basin: AAPG Annual Convention, Long Beach, California, April 1–4, 2007.
- ↑ Loucks, R. G., R. M. Reed, S. C. Ruppel, and D. M. Jarvie, 2009, Morphology, genesis, and distribution of nanometer-scale pores in siliceous mudstones of the Mississippian Barnett Shale: Journal of Sedimentary Research, v. 79, p. 848–861, doi:10.2110/jsr.2009.092.
- ↑ Barker, C., 1974, Pyrolysis techniques for source rock evaluation: AAPG Bulletin, v. 58, no. 11, p. 2349–2361.
- ↑ 18.0 18.1 18.2 18.3 18.4 18.5 18.6 18.7 Lopatin, N. V., S. L. Zubairaev, I. M. Kos, T. P. Emets, E. A. Romanov, and O. V. Malchikhina, 2003, Unconventional oil accumulations in the Upper Jurassic Bazhenov Black Shale Formation, West Siberian Basin: A self-sourced reservoir system: Journal of Petroleum Geology, v. 26, no. 2, p. 225–244, doi:10.1111/j.1747-5457.2003.tb00027.x.
- ↑ 19.0 19.1 Jarvie, D. M., J. T. Senftle, W. Hughes, L. Dzou, J. J. Emme, and R. J. Elsinger, 1995, Examples and new applications in applying organic geochemistry for detection and qualitative assessment of overlooked petroleum reservoirs, in J. O. Grimalt and C. Dorronsoro, eds., Organic geochemistry: Developments and applications to energy, climate, environment, and human history: 17th International Meeting on Organic Geochemistry, p. 380–382.
- ↑ 20.0 20.1 Pepper, A. S., 1992, Estimating the petroleum expulsion behavior of source rocks: A novel quantitative approach, in W. A. England and A. L. Fleet, eds., Petroleum migration: Geological Society (London) Special Publication 59, p. 9–31.
- ↑ Cooles, G. P., A. S. Mackenzie, and T. M. Quigley, 1986, Calculation of petroleum masses generated and expelled from source rocks: Organic Geochemistry, v. 10, p. 235–245, doi:10.1016/0146-6380(86)90026-4.
- ↑ Jarvie, D. M., A. Morelos, and Z. Han, 2001a, Detection of pay zones and pay quality, Gulf of Mexico: Gulf Coast Association of Geological Societies Transactions 51st Annual Convention, Shreveport, Louisiana, October 17–19, v. LI, p. 151–160.
- ↑ Williams, P., 2010, Oil-prone shales: Oil and Gas Investor.
- ↑ U. S. Geological Survey, 2003, 2002 U.S. Geological Survey assessment of oil and gas resource potential of the Denver Basin Province of Colorado, Kansas, Nebraska, South Dakota, and Wyoming: U.S. Geological Survey Fact Sheet FS-002-03, February 2003, 3 p.
- ↑ 25.0 25.1 North Dakota Geological Survey, 2010, Bakken horizontal wells by producing zone, upper Bakken Shale.
- ↑ Jarvie, D. M., 1991, Factors affecting Rock-Eval-derived kinetic parameters: Chemical Geology, v. 93, p. 79–99, doi:10.1016/0009-2541(91)90065-Y.
- ↑ Pepper, A. S., and P. J. Corvi, 1995, Simple models of petroleum formation. Part I: Oil and gas generation from kerogen: Marine and Petroleum Geology, v. 12, p. 291–320.
- ↑ Jarvie, D. M., and L. L. Lundell, 2001, Chapter 15: Amount, type, and kinetics of thermal transformation of organic matter in the Miocene Monterey Formation, in C. M. Isaacs and J. Rullkotter, eds., The Monterey Formation: From rocks to molecules: New York, Columbia University Press, p. 268–295.
- ↑ North Dakota Geological Survey, 2008, Bakken TOCs.
- ↑ Durham, L. S., 2009, Learning curve continues: Elm Coulee idea opened new play: AAPG Explorer, August 2009.
- ↑ Meissner, F. F., 1978, Petroleum geology of the Bakken Formation, Williston Basin, North Dakota and Montana, in D. Estelle and R. Miller, eds., The economic geology of the Williston Basin, 1978 Williston Basin Symposium: Billings, Montana, Montana Geological Society, p. 207–230.
- ↑ Dembicki Jr., H., and F. L. Pirkle, 1985, Regional source rock mapping using a source potential rating index: AAPG Bulletin, v. 69, no. 4, p. 567–581.
- ↑ Johnson, M. S., 2009, Parshall field, North Dakota: Discovery of the year for the Rockies and beyond: Adapted from the oral presentation at AAPG Annual Convention, Denver, Colorado, June 7–10, 2009, Search and Discovery article 20081, posted September 25, 2009, 29 p.
- ↑ 34.0 34.1 34.2 34.3 34.4 34.5 Jarvie, D. M., R. J. Coskey, M. S. Johnson, and J. E. Leonard, 2011, The geology and geochemistry of the Parshall field area, Mountrail County, North Dakota, in J. W. Robinson, J. A. LeFever, and S. B. Gaswirth, eds., The Bakken-Three Forks petroleum system in the Williston Basin: Denver, Colorado, Rocky Mountain Association of Geologists, p. 229–281.
- ↑ Jarvie, D. M., 2001, Williston Basin petroleum systems: Inferences from oil geochemistry and geology: The Mountain Geologist, v. 38, p. 19–41.
- ↑ Mango, F. D., and D. M. Jarvie, 2001, GOR from oil composition (abs.): 20th International Meeting on Organic Geochemistry, Nancy, France, September 10–14, 2001, v. 1, p. 406–407.
- ↑ 37.0 37.1 37.2 Jarvie, D. M., 2011, Unconventional oil petroleum systems: Shales and shale hybrids: AAPG International Conference and Exhibition, Calgary, Alberta, Canada, September 12–15, 2010.
- ↑ Price, L. C., T. Ging, T. Daws, A. Love, M. Pawlewicz, and D. Anders, 1984, Organic metamorphism in the Mississippian–Devonian Bakken Shale, North Dakota portion of the Williston Basin, in J. Woodward, F. F. Meissner, and J. L. Clayton, eds., Hydrocarbon source rocks of the greater Rocky Mountain region: Denver, Colorado, Rocky Mountain Association of Geologists, p. 83–133.
- ↑ Oil & Gas Journal, 2010c, Whiting Petroleum's sweet spot is most prolific part of the Bakken.
- ↑ BeMent, W. O., R. A. Levey, and F. D. Mango, 1994, The temperature of oil generation as defined with a C7 chemistry maturity parameter (2,4-DMP/2,3-DMP ratio): First Joint AAPG/AMPG Research Conference, Geological Aspects of Petroleum Systems, October 2–6, 1994, Mexico City, Mexico.
- ↑ Mango, F. D., 1997, The light hydrocarbons in petroleum: A critical review: Organic Geochemistry, v. 26, no. 7/8, p. 417–440.
- ↑ Jarvie, D. M., R. J. Elsinger, and R. F. Inden, 1996, A comparison of the rates of hydrocarbon generation, from Lodgepole, False Bakken, and Bakken Formation petroleum source rocks, Williston Basin: 1996 Rocky Mountain Section Meeting, AAPG, Billings, Montana, p. 153–158.
- ↑ 43.0 43.1 43.2 43.3 43.4 Tanck, G. S., 1997, Distribution and origin of organic carbon in the Upper Cretaceous Niobrara Formation and Sharon Springs Member of the Pierre Shale, Western Interior, United States: Ph.D. thesis, University of Arizona, Tuscon, Arizona, 411 p.
- ↑ 44.0 44.1 44.2 44.3 IHS Energy News on Demand, 2010, Details reported on horizontal discovery in Power River Basin, March 16, 2010, press release.
- ↑ Hill, R. J., D. M. Jarvie, R. M. Pollastro, M. Henry, and J. D. King, 2007, Oil and gas geochemistry and petroleum systems of the Fort Worth Basin, AAPG Bulletin Special Issue: AAPG Bulletin, v. 91, no. 4, p. 445–473, doi:10.1306/11030606014.
- ↑ Jarvie, D. M., R. J. Hill, T. E. Ruble, and R. M. Pollastro, 2007, Unconventional shale-gas systems: The Mississippian Barnett Shale of north-central Texas as one model for thermogenic shale-gas assessment, in R. J. Hill and D. M. Jarvie, eds., AAPG Bulletin Special Issue: Barnett Shale, v. 90, no. 4, p. 475–499.
- ↑ L. Brogdon, 2008, personal communication
- ↑ Bowker, K., 2007, Barnett Shale gas production, Fort Worth Basin: Issues and discussion: AAPG Bulletin, v. 91, no. 4, p. 523–533, doi:10.1306/06190606018.
- ↑ Darbonne, N., 2010, EOG's Mark Papa: Barnett combo one of the “richest oil deposits we've ever encountered”: Oil and Gas Investor, February 2010.
- ↑ 50.0 50.1 50.2 Grabowski, G. J., 1995,Organic-rich chalks and calcareous mudstones of the Upper Cretaceous Austin Chalk and Eagleford Formation, south-central Texas, in B. J. Katz, ed., Petroleum source rocks: Berlin, Germany, Springer-Verlag, p. 209–234.
- ↑ D. M. Jarvie, unpublished data
- ↑ Jarvie, D. M., 2007, Organic geochemical constraints on mudstone productivity: HGS Applied Geoscience Conference (AGC) on Mudstones, October 1–2, 2007, Houston, Texas.
- ↑ J. A. Breyer, 2010, personal communication
- ↑ 54.0 54.1 54.2 Chidsey, T. C., C. D. Morgan, and R. L. Bon, 2004, Major oil plays in Utah and vicinity: Quarterly technical progress report, reporting period April 1 to June 30, 2004, dated July 2004, 18 p.
- ↑ 55.0 55.1 Rasmussen, L., T. Smith, L. Canter, M. Sonnenfeld, and J. Forster, 2010, Analysis of a long Cane Creek horizontal: New insight into an unconventional tight oil resource play, Paradox Basin, Utah (abs.): AAPG Rocky Mountain Section meeting, Durango, Colorado, June 13–16, 2010, AAPG Search and Discovery 90106.
- ↑ 56.0 56.1 John, C., B. L. Jones, J. E. Moncrief, R. Bourgeois, and B. J. Harder, 1997, An unproven unconventional seven-billion barrel oil resource: The Tuscaloosa Marine Shale.
- ↑ 57.0 57.1 Miranda, R. M., and C. C. Walters, 1992, Geochemical variations in sedimentary matter within a “homogeneous” shale core (Tuscaloosa Formation, Upper Cretaceous, Mississippi: Organic Geochemistry, v. 18, no. 6, p. 899–911, doi:10.1016/0146-6380(92)90057-5.
- ↑ Oil & Gas Journal, 2010a, Montana Heath Shale oil potential due tests.
- ↑ 59.0 59.1 Cella, G. A., and R. J. Drozd, 1994, Heath-Tyler(!) petroleum system in central Montana, in L. B. Magoon and W. G. Dow, eds., The petroleum system: From source to trap: AAPG Memoir 60, p. 371–385.
- ↑ Nyahay, R., J. Leone, L. Smith, J. Martin, and D. Jarvie, 2007, Shale gas potential in New York: Result from recent NYSERDA-sponsored research, AAPG Annual Meeting, Long Beach, California, April 1–4, 2007, AAPG Bulletin.
- ↑ 61.0 61.1 61.2 Oil & Gas Journal, 2010b, Pioneer to pursue oil in Lower Wolfcamp shale.
- ↑ 62.0 62.1 62.2 Jarvie, D. M., J. D. Burgess, A. Morelos, R. K. Olson, P. A. Mariotti, and R. Lindsey, 2001b, Permian Basin petroleum systems investigations: Inferences from oil geochemistry and source rocks: AAPG Midcontinent Section Meeting, Amarillo, Texas, September 30–October 2, 2001: AAPG Bulletin, v. 85, no. 9, p. 1693–1694.
- ↑ Riediger, C. L., M. G. Fowler, P. W. Brooks, and L. R. Snowdon, 1990, Triassic oils and potential Mesozoic source rocks: Peace River arch area, Western Canada Basin: Organic Geochemistry, v. 16, no. 1–3, p. 295–305, doi:10.1016/0146-6380(90)90049-6.
- ↑ 64.0 64.1 Espitalie, J., J. R. Maxwell, P. Y. Chenet, and F. Marquis, 1988, Aspects of hydrocarbon migration in the Mesozoic in the Paris Basin as deduced from an organic geochemical survey, Advances in Organic Geochemistry 1987: Organic Geochemistry, v. 13, no. 1–3, p. 467–481, doi:10.1016/0146-6380(88)90068-X.
- ↑ Toreador Resources: 2010, Paris Basin shale oil: Toreador taking the lead, Unconventional Oil 2010, October 12, 2010, London.
- ↑ Vermillion Energy, 2010, November 2010 investor report
- ↑ Rullkotter, J., et al., 1988, Organic matter maturation under the influence of a deep instrusive heat source: A natural experiment for quantitation of hydrocarbon generation and expulsion from a petroleum source rock (Toarcian Shale, northern Germany), Advances in Organic Geochemistry 1987: Organic Geochemistry, v. 13, no. 1–3, p. 847–856, doi:10.1016/0146-6380(88)90237-9.
- ↑ 68.0 68.1 TAG Oil, 2010.
- ↑ Francis, D., 2007, Reservoir analysis of Whangai Formation and Waipawa Black Shale: GNS New Zealand Government report, 11 p.