Uploads by Matt
Jump to navigation
Jump to search
This special page shows all uploaded files.
| Date | Name | Thumbnail | Size | Description | Versions |
|---|---|---|---|---|---|
| 18:42, 23 January 2014 | AAPG Wiki banner.png (file) | 286 KB | Wider left-hand element | 3 | |
| 19:51, 27 March 2014 | AAPG Wiki banner Mar2014.png (file) | 195 KB | white at bottom | 2 | |
| 13:00, 1 July 2014 | AAPG Wiki file page example.png (file) |  |
1.29 MB | Example file page | 1 |
| 18:38, 1 July 2013 | AAPG wiki project timeline 2013-07-01.svg (file) |  |
27 KB | Rough project timeline, early edition | 1 |
| 19:19, 18 January 2014 | Ambox deletion.png (file) |  |
2 KB | Public domain. | 1 |
| 22:54, 17 January 2014 | Applying-gravity-in-petroleum-exploration fig15-16.jpg (file) |  |
721 KB | Category:Applying gravity in petroleum exploration | 1 |
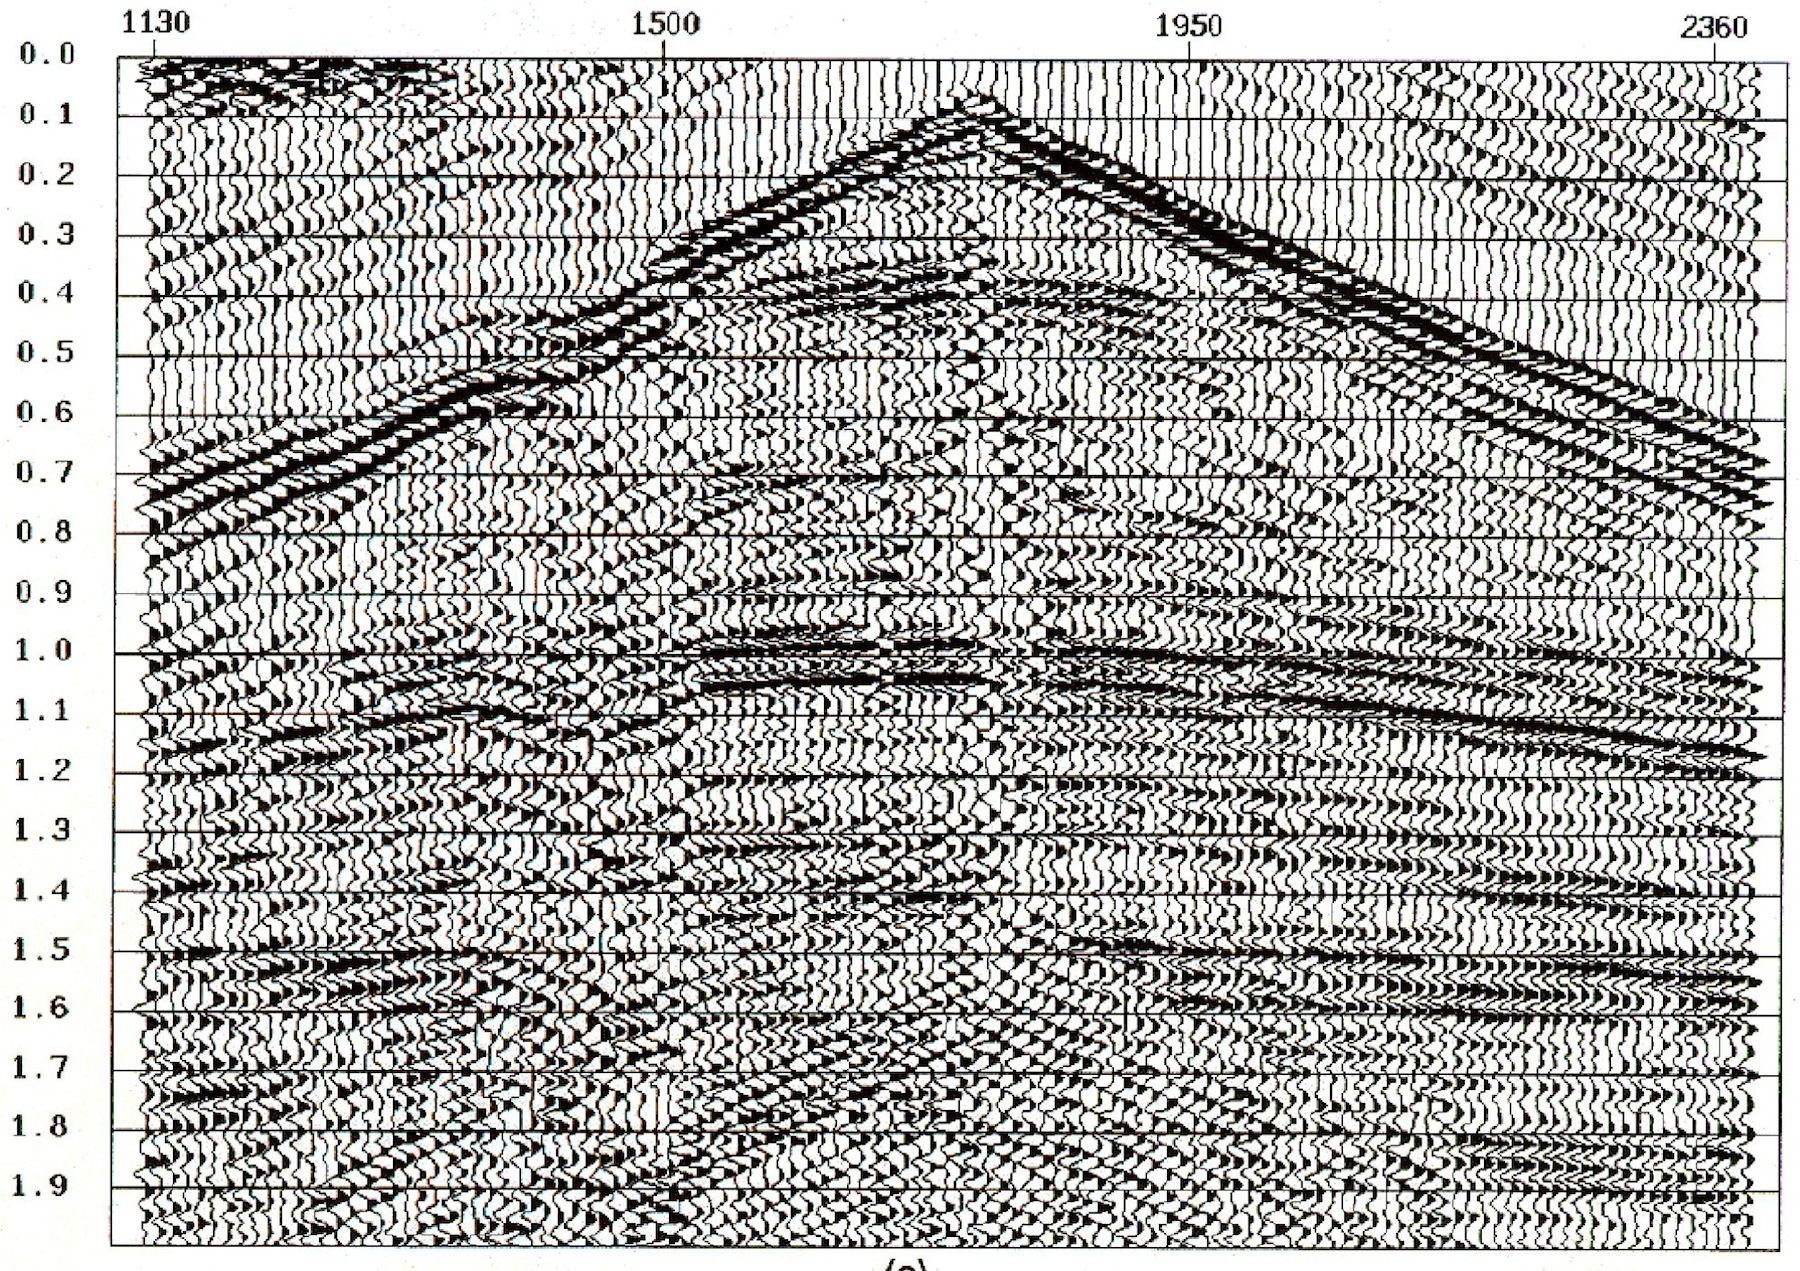
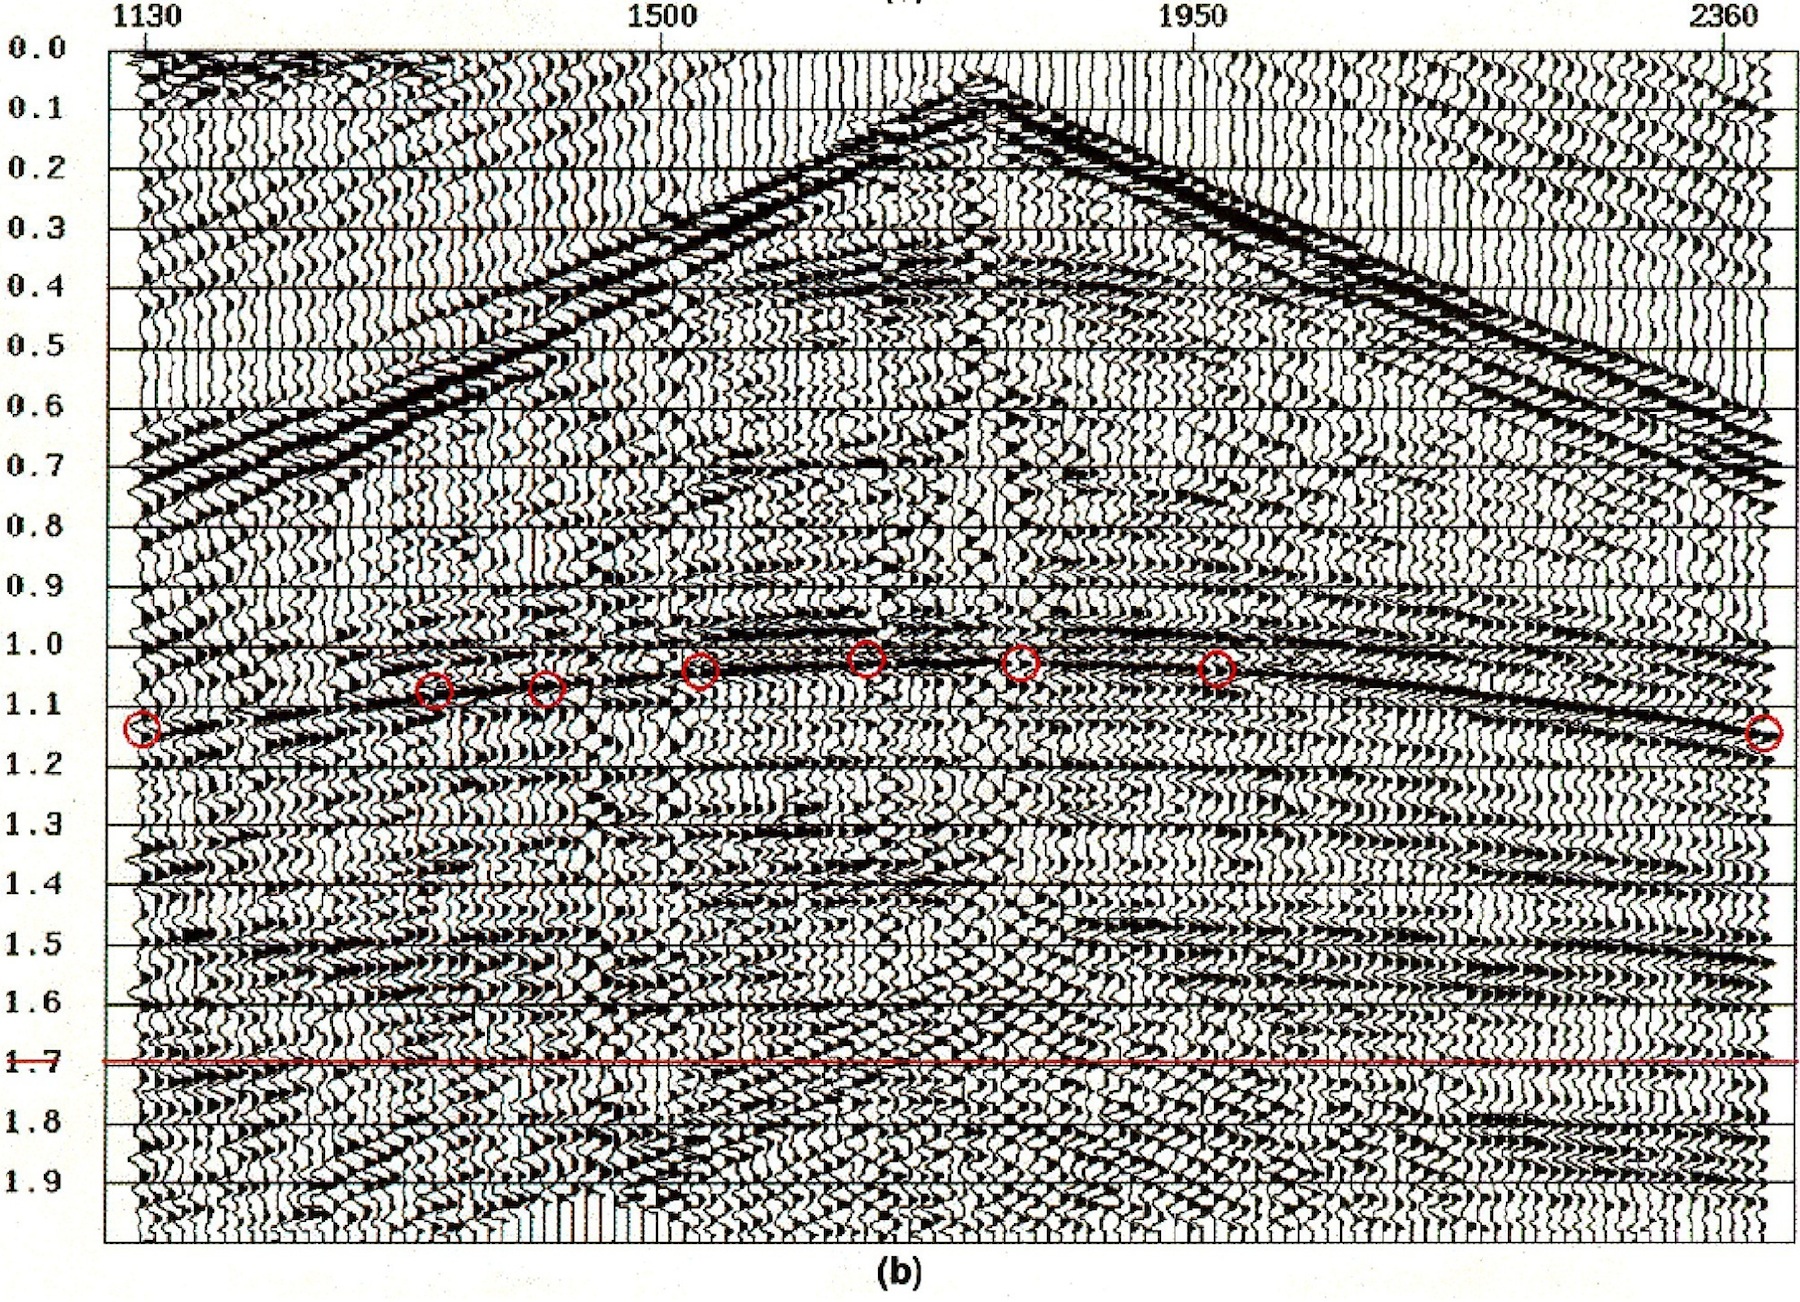
| 18:44, 15 January 2014 | Basic-seismic-processing fig5-part1.jpg (file) |  |
1.47 MB | See also File:Basic-seismic-processing_fig5-part2.jpg Category:Geophysical methods | 1 |
| 18:46, 15 January 2014 | Basic-seismic-processing fig5-part2.jpg (file) |  |
1.51 MB | See also File:Basic-seismic-processing_fig5-part1.jpg Category:Geophysical methods | 1 |
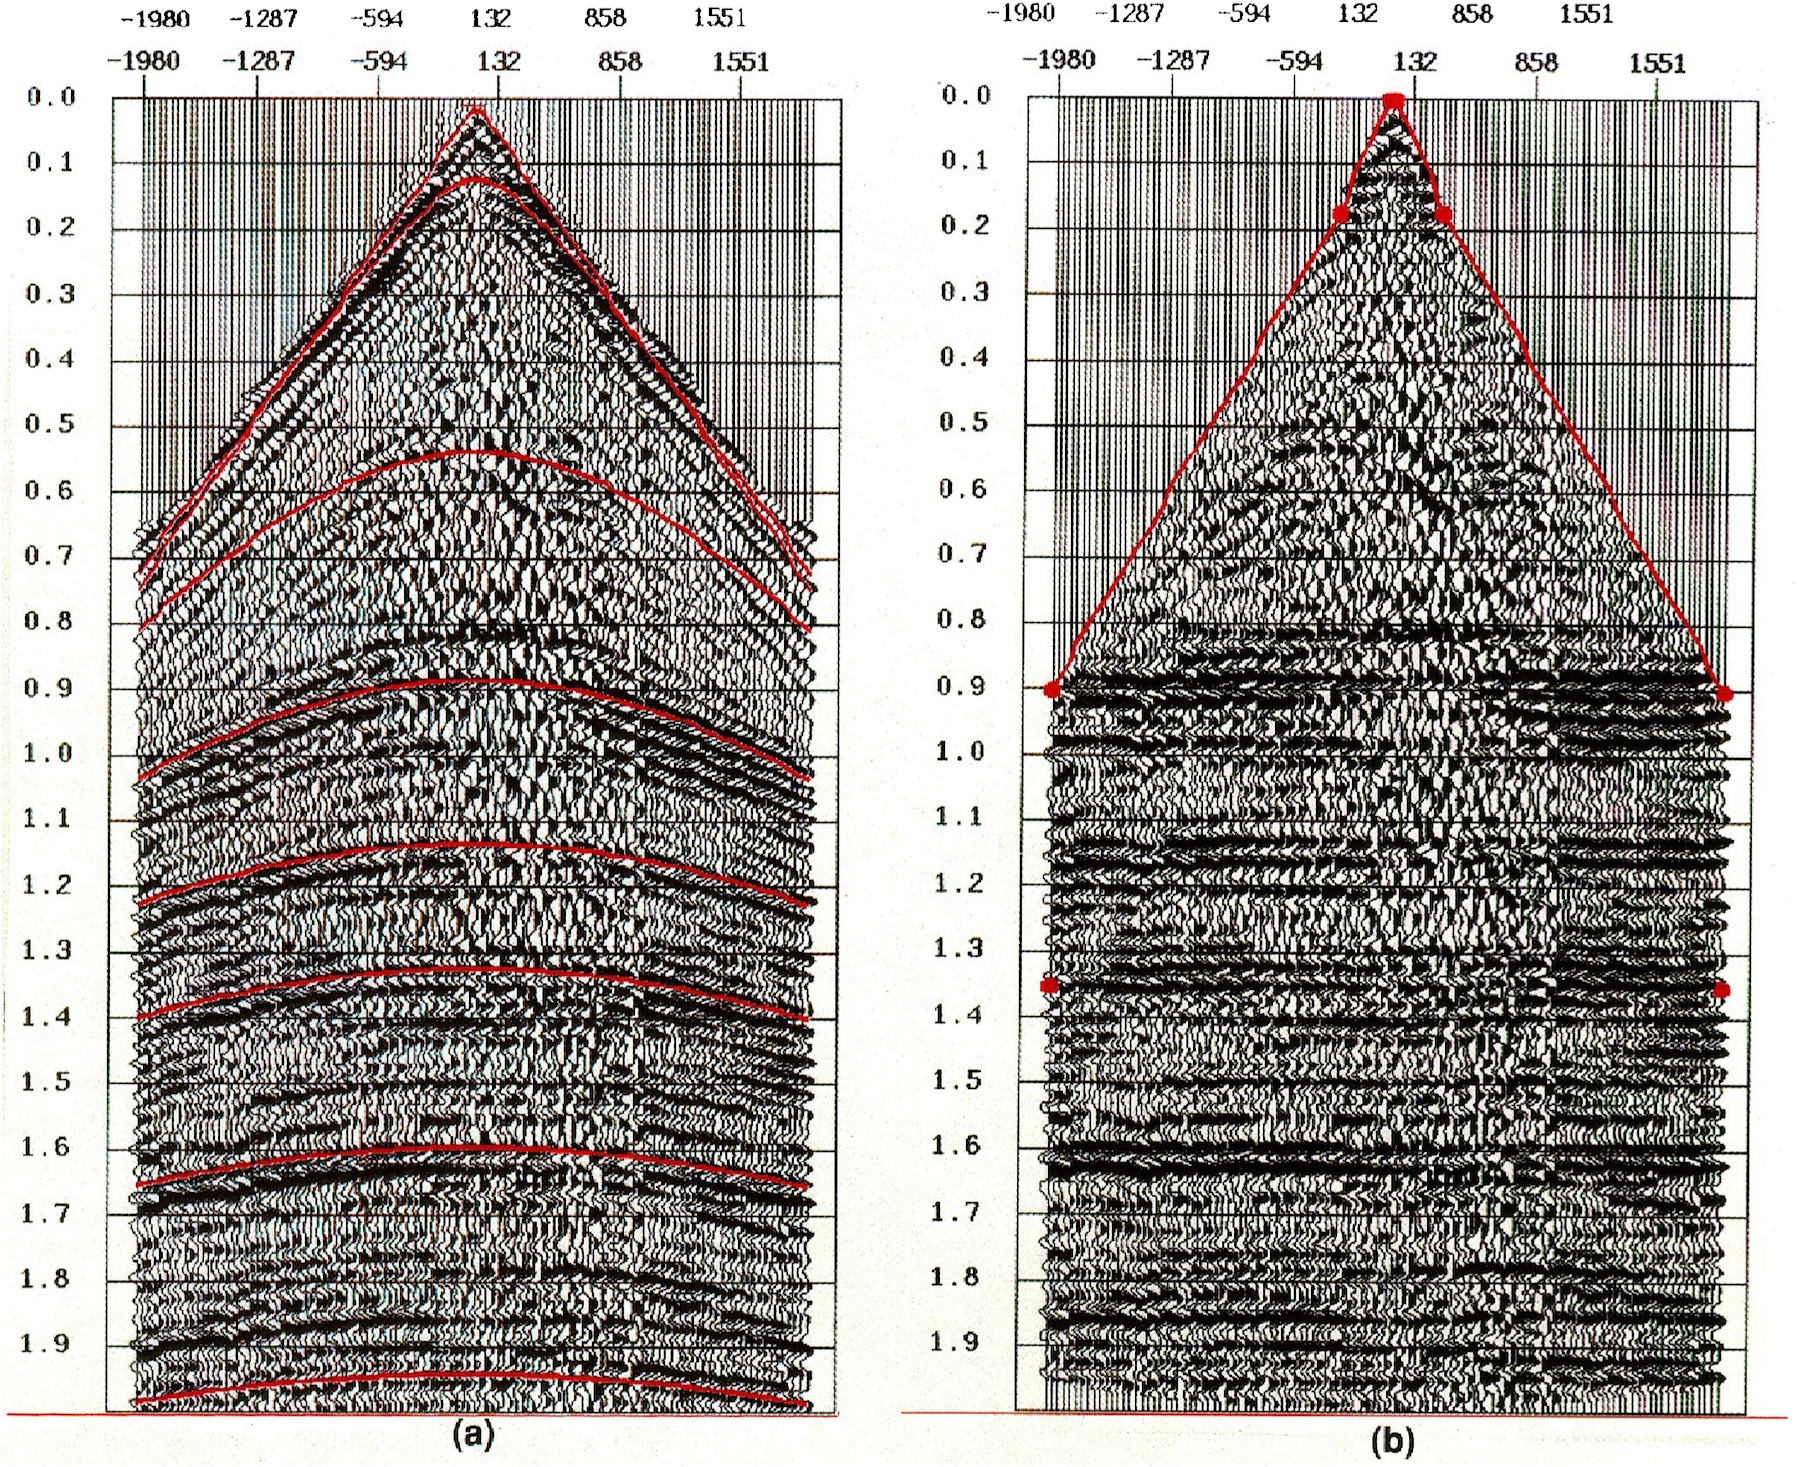
| 18:47, 15 January 2014 | Basic-seismic-processing fig6.jpg (file) |  |
1.57 MB | Category:Geophysical methods | 1 |
| 14:37, 6 August 2013 | Boy1.png (file) |  |
27 KB | iStockPhoto, licensed | 1 |
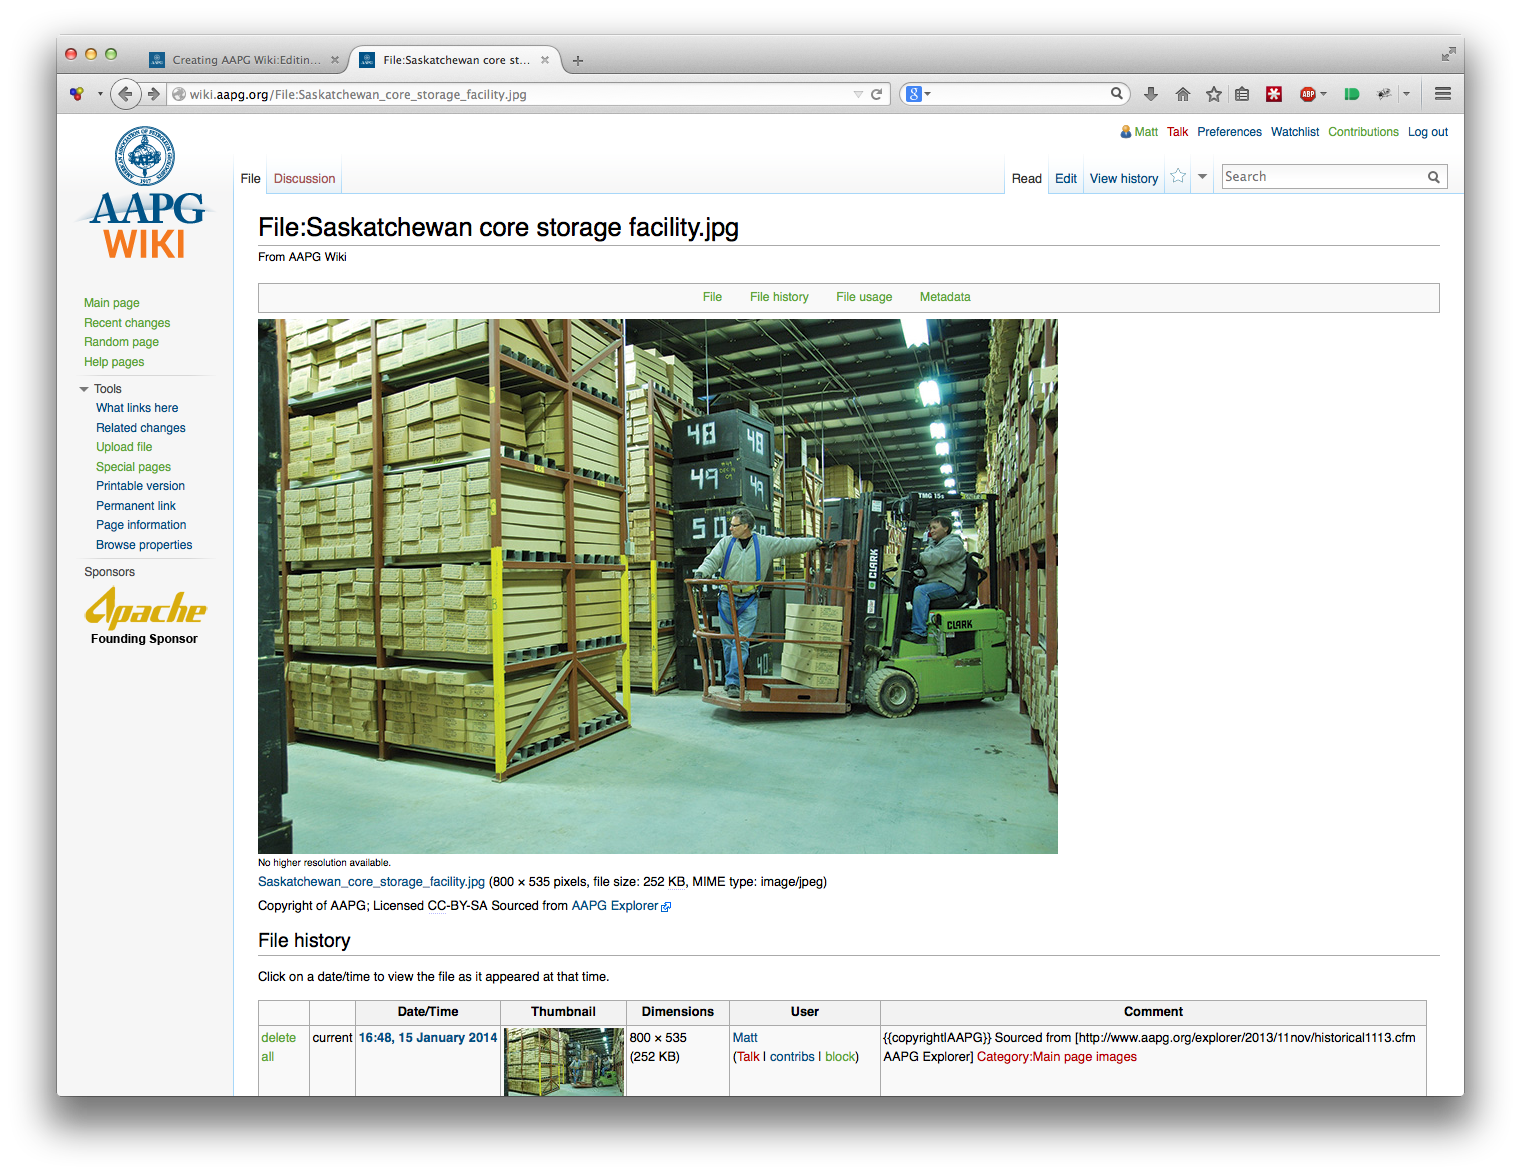
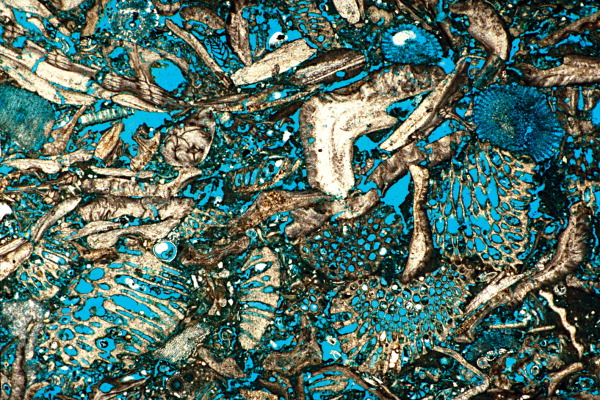
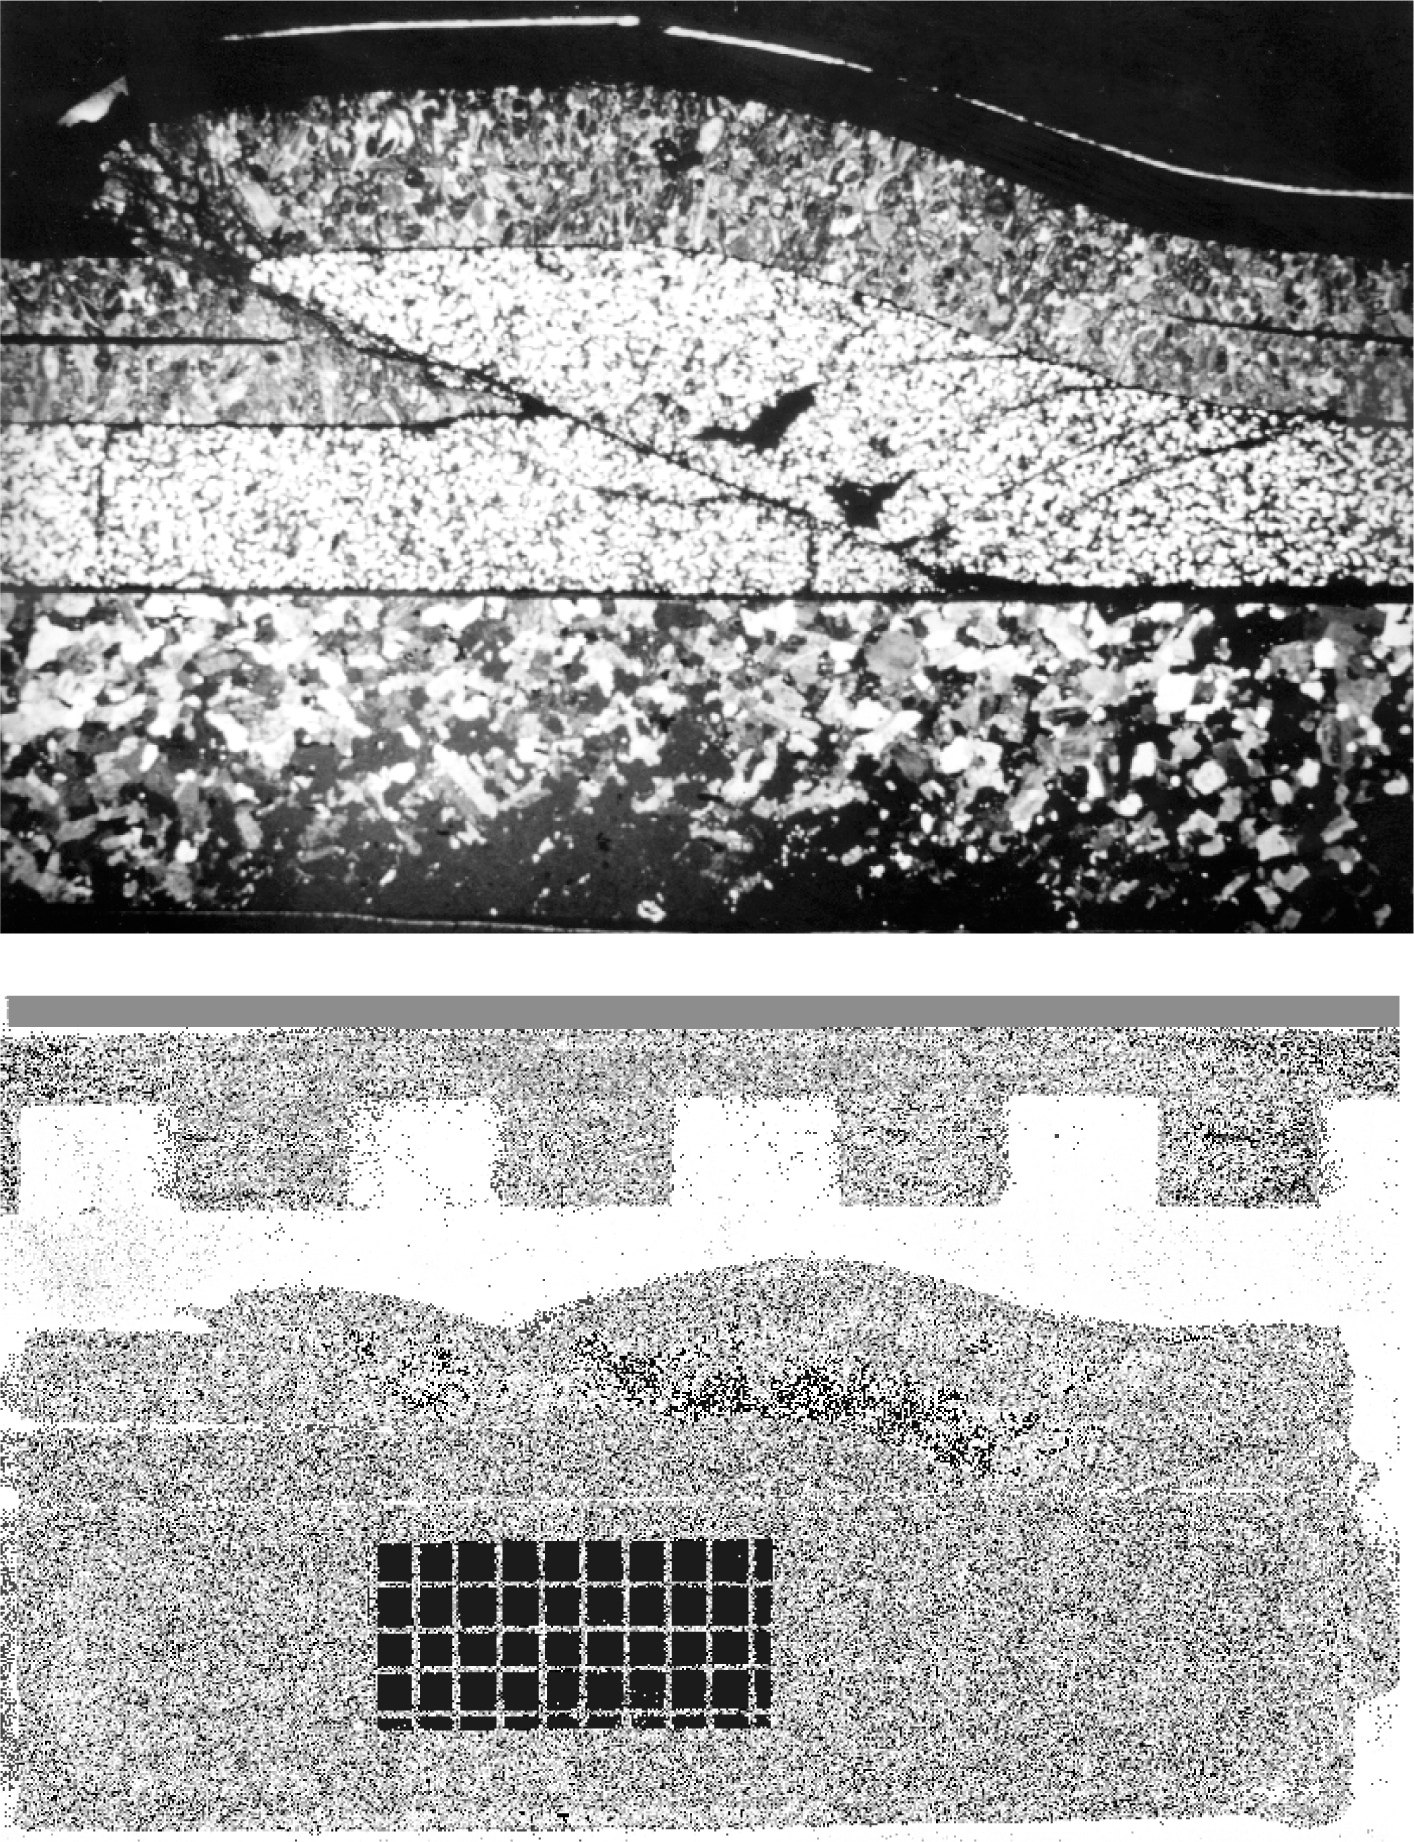
| 16:50, 15 January 2014 | Carbonate porosity Mid-Pliocene Upper Haurangi Ls.jpg (file) |  |
225 KB | {{copyright}} Sourced from AAPG Memoir 77, Chapter 21, [http://archives.datapages.com/data/specpubs/memoir77/m77ch21/m77ch21.htm AAPG Datapages] Category:Main page images | 1 |
| 16:50, 9 October 2013 | Cc-by-sa.png (file) |  |
17 KB | badge for cc-by-sa | 1 |
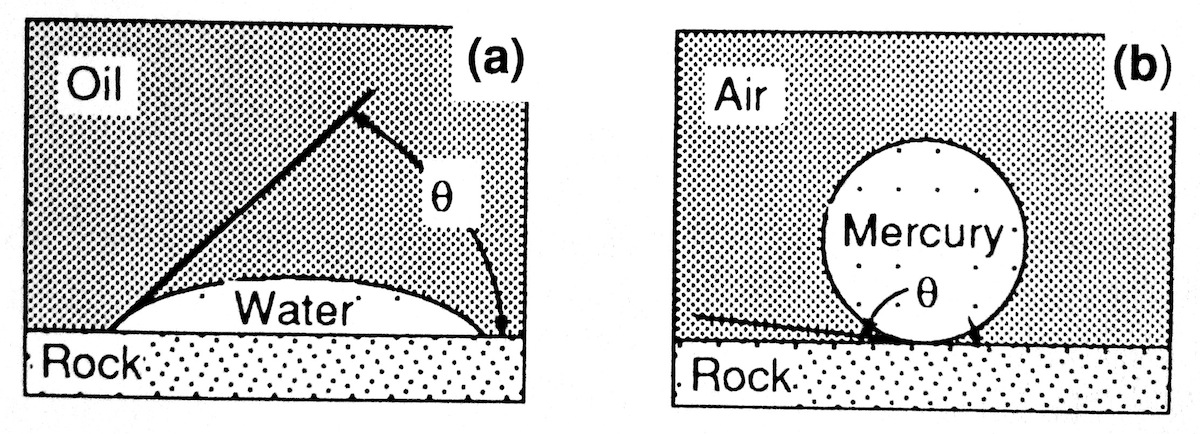
| 17:41, 13 September 2013 | Charles-l-vavra-john-g-kaldi-robert-m-sneider capillary-pressure 1.jpg (file) |  |
272 KB | Effects of interaction of adhesive and cohesive forces on wettability. (a) If adhesive forces are greater than the cohesive forces, the fluid spreads out on the surface and is termed wetting. (b) If cohesive forces exceed adhesive forces, the liquid be... | 1 |
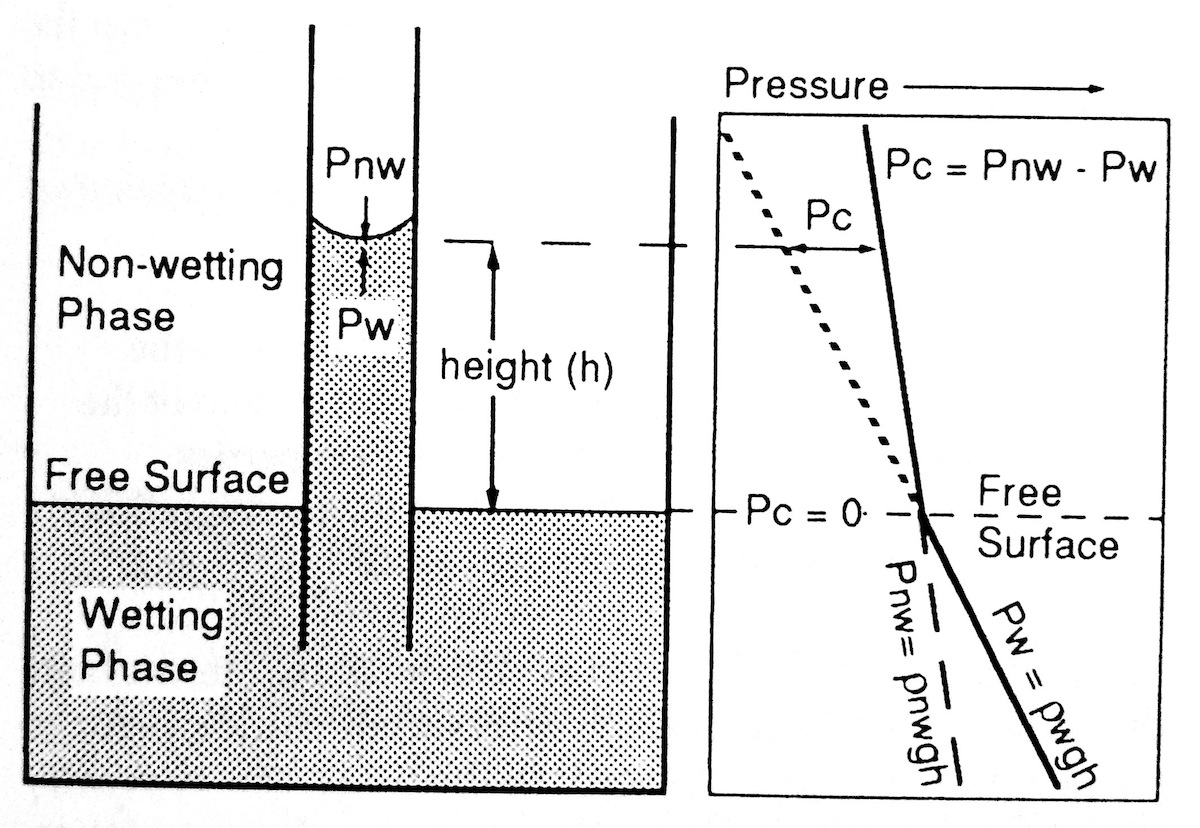
| 17:41, 13 September 2013 | Charles-l-vavra-john-g-kaldi-robert-m-sneider capillary-pressure 2.jpg (file) |  |
279 KB | The wetting phase rises above the original or free surface in the capillary tube experiment until adhesive and gravitational forces balance. Capillary pressure (Pc) is the difference in pressure measured across the interface in the capillary (Pc = Pnw ... | 1 |
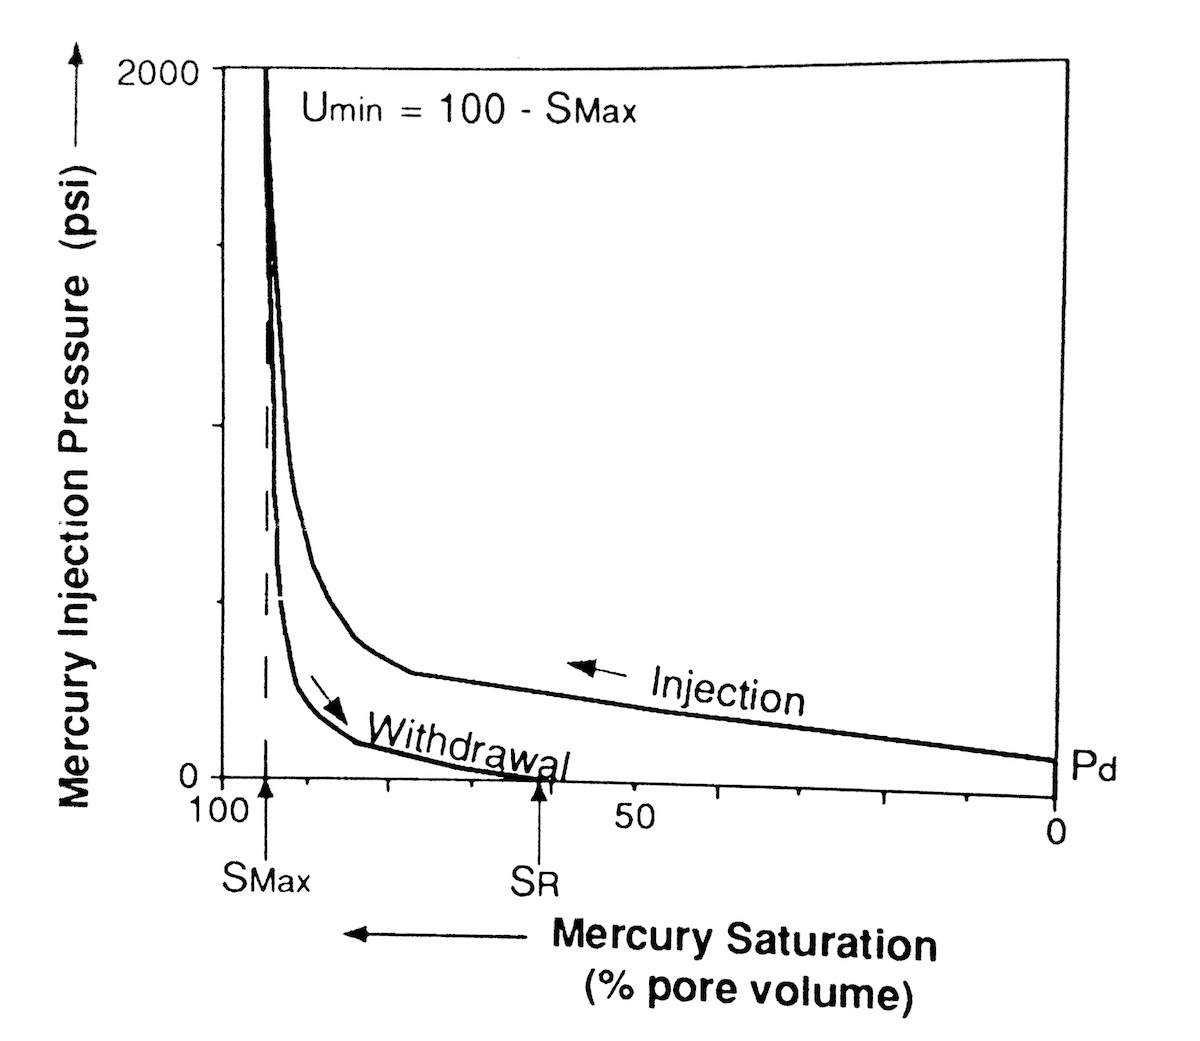
| 17:42, 13 September 2013 | Charles-l-vavra-john-g-kaldi-robert-m-sneider capillary-pressure 3.jpg (file) |  |
122 KB | Mercury injection capillary pressure curve terminology. | 1 |
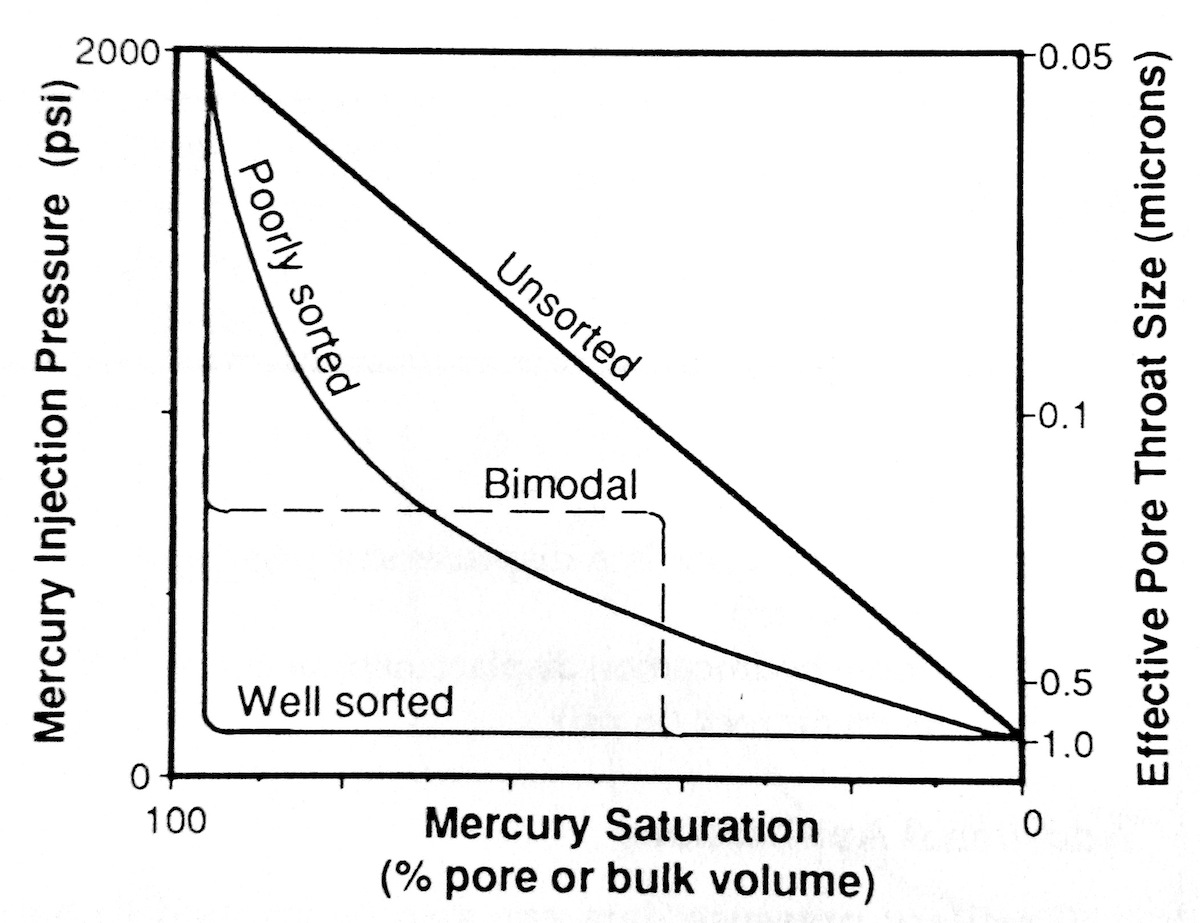
| 17:45, 13 September 2013 | Charles-l-vavra-john-g-kaldi-robert-m-sneider capillary-pressure 4.jpg (file) |  |
178 KB | Idealized mercury injection capillary pressure curve shapes. Note that all of the curves have identical displacement pressures and minimum unsaturated pore volumes, but that the saturation profiles would differ dramatically due to differences in pore t... | 1 |
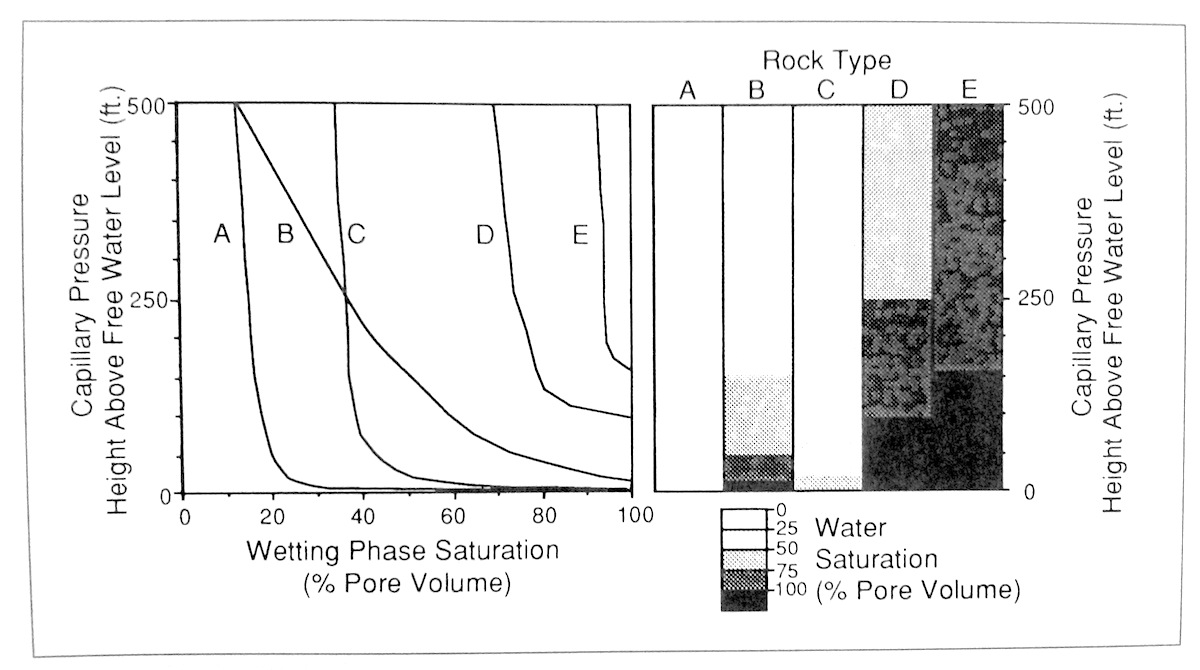
| 17:42, 13 September 2013 | Charles-l-vavra-john-g-kaldi-robert-m-sneider capillary-pressure 5.jpg (file) |  |
154 KB | Effect of capillary pressure (left) on water saturation (right). At any given height above the free water level, water saturations vary widely among rock types (A-E) due to diffferences in capillarity. For example, at 50 ft above free water level, wate... | 1 |
| 19:02, 17 March 2014 | Core-handling large.png (file) |  |
98 KB | Image should be at least 300 x 200 for the front page gallery. I think. | 2 |
| 17:12, 15 January 2014 | Cross-borehole-tomography-in-development-geology fig4.jpg (file) |  |
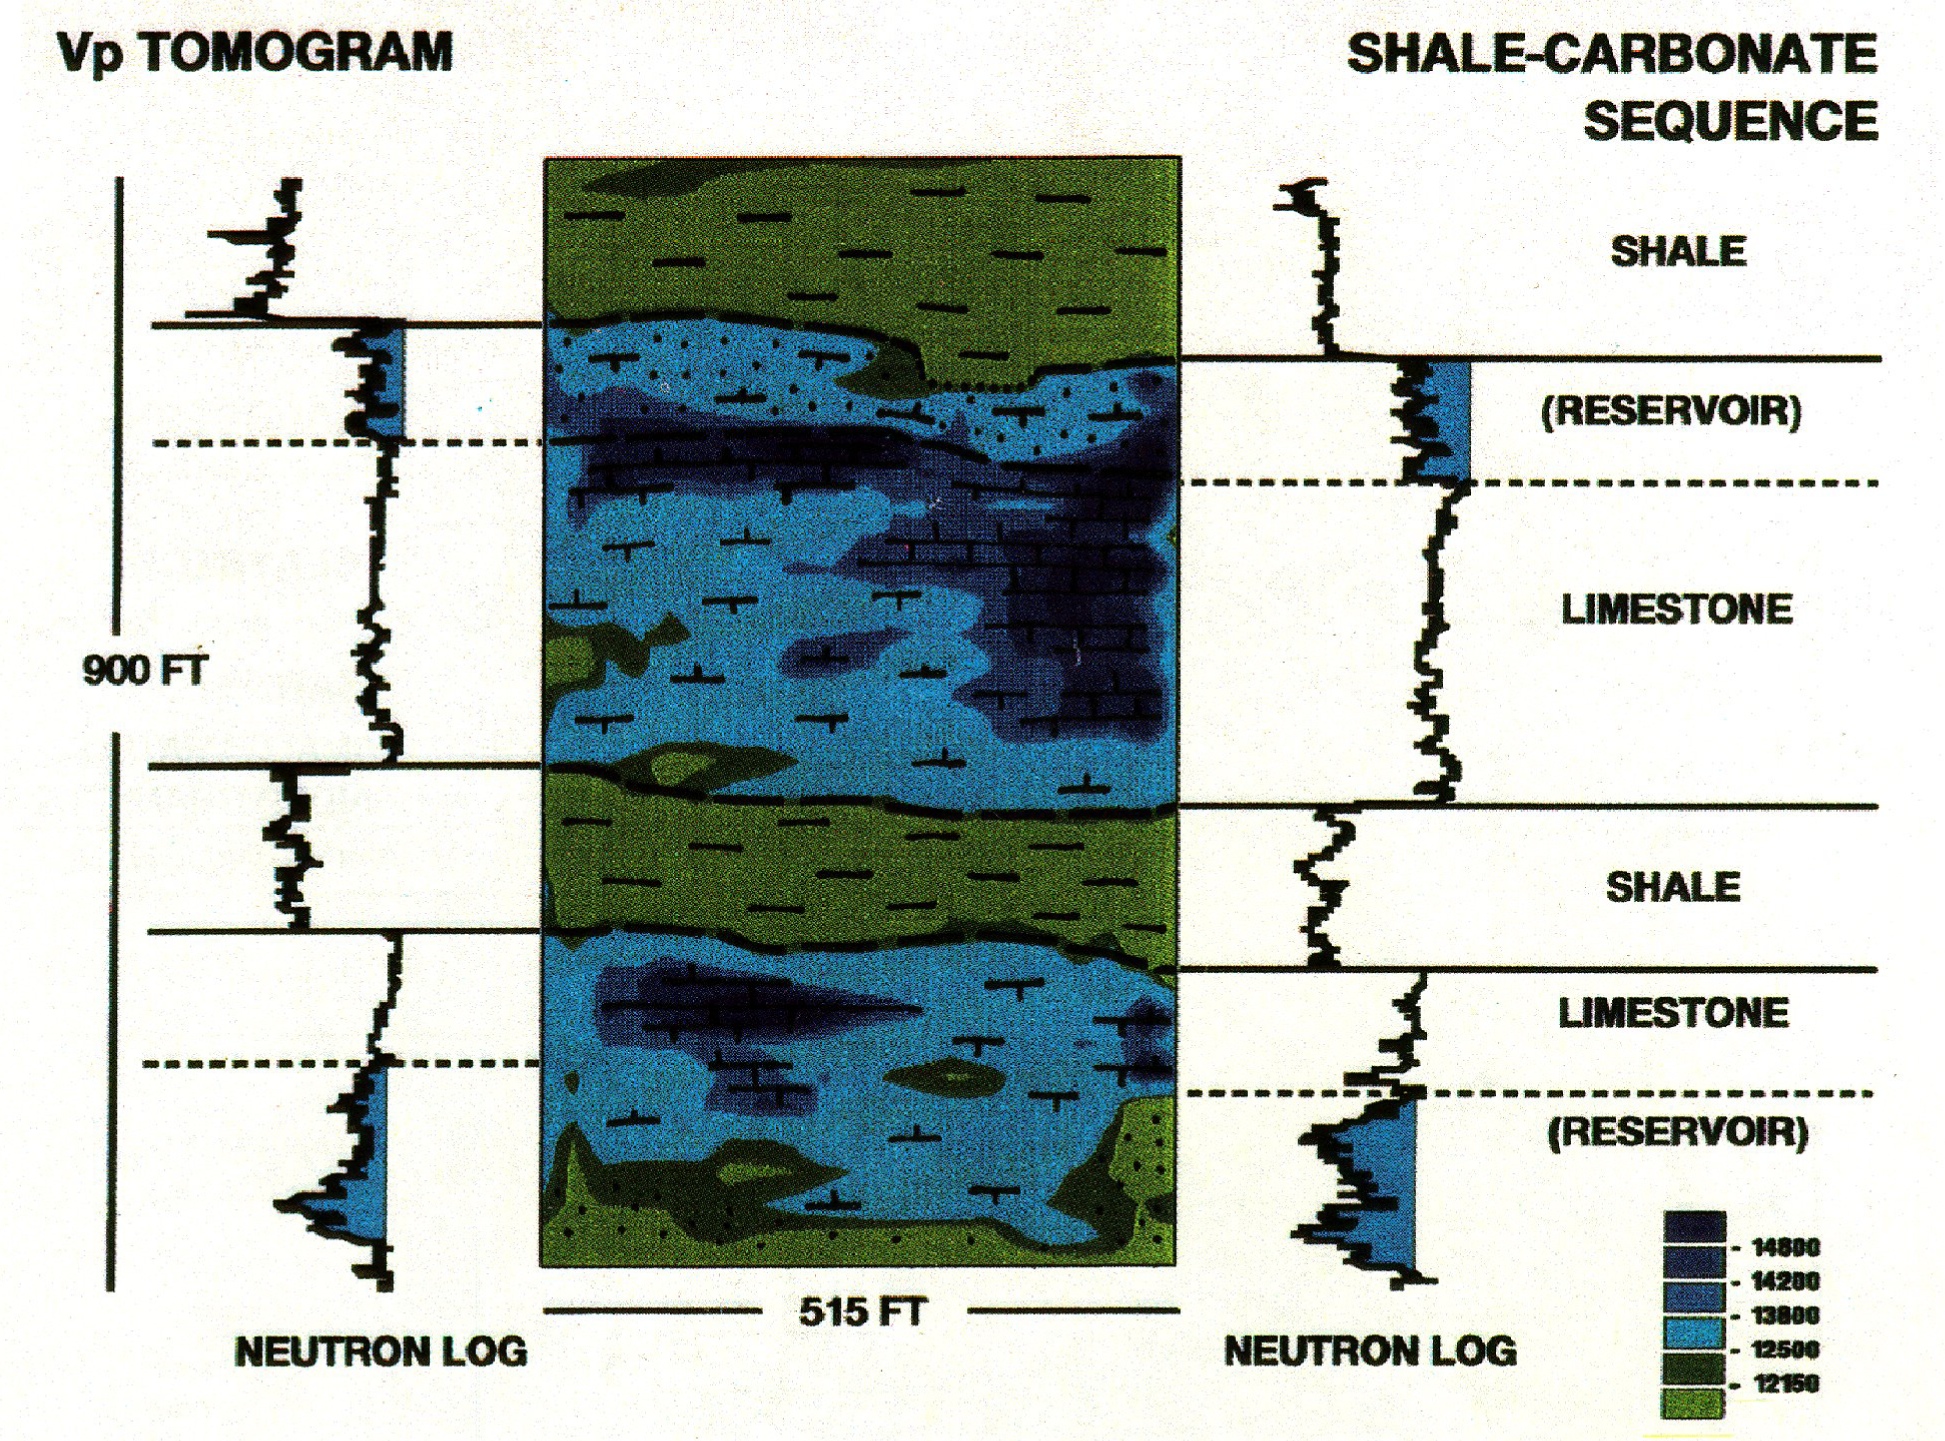
1.35 MB | Single image tomograms documenting stratigraphy and reservoir zones. Heterogeneity of the lower reservoir is documented by the contrast in log curves and the corresponding change in the tomographic velocity fields. (After Justice et al., 1990.). See [[... | 1 |
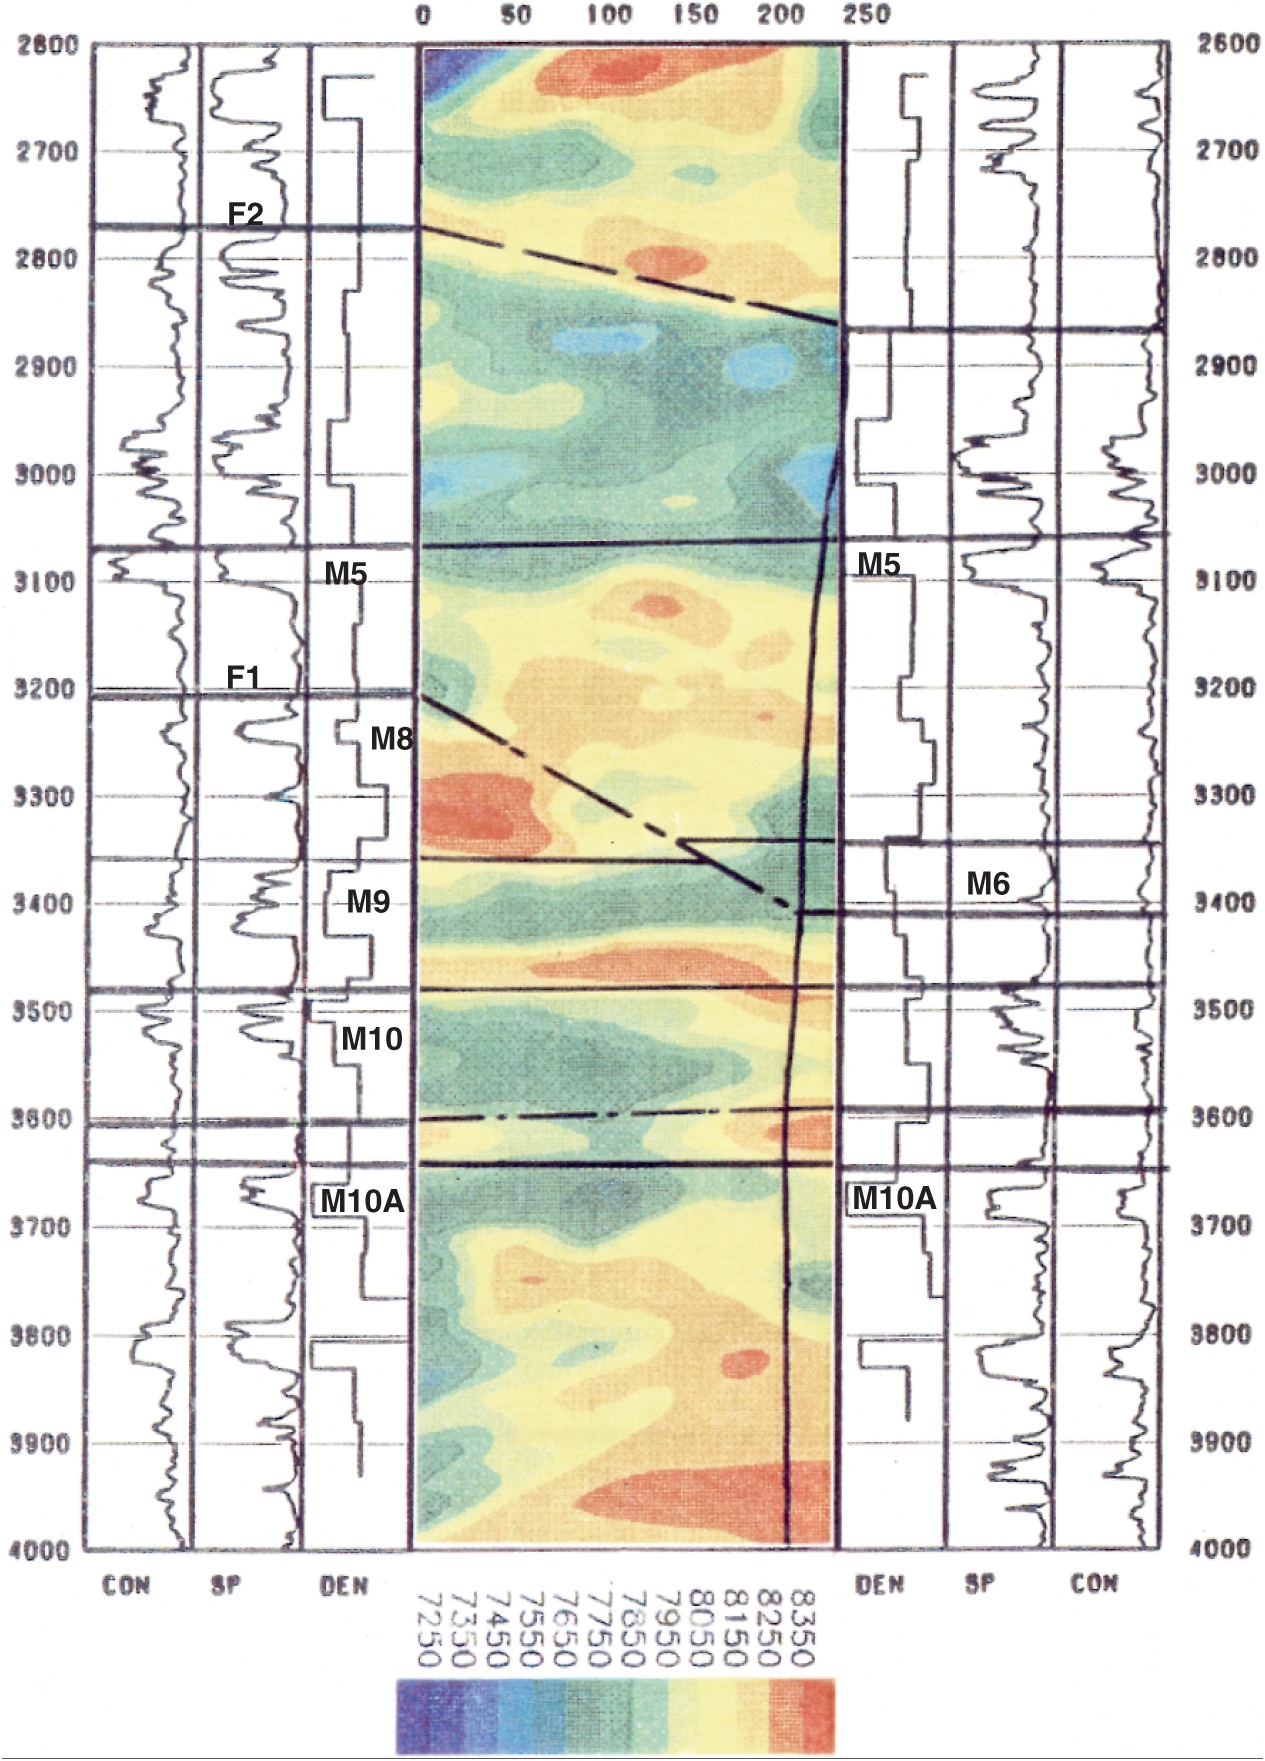
| 17:12, 15 January 2014 | Cross-borehole-tomography-in-development-geology fig5.jpg (file) |  |
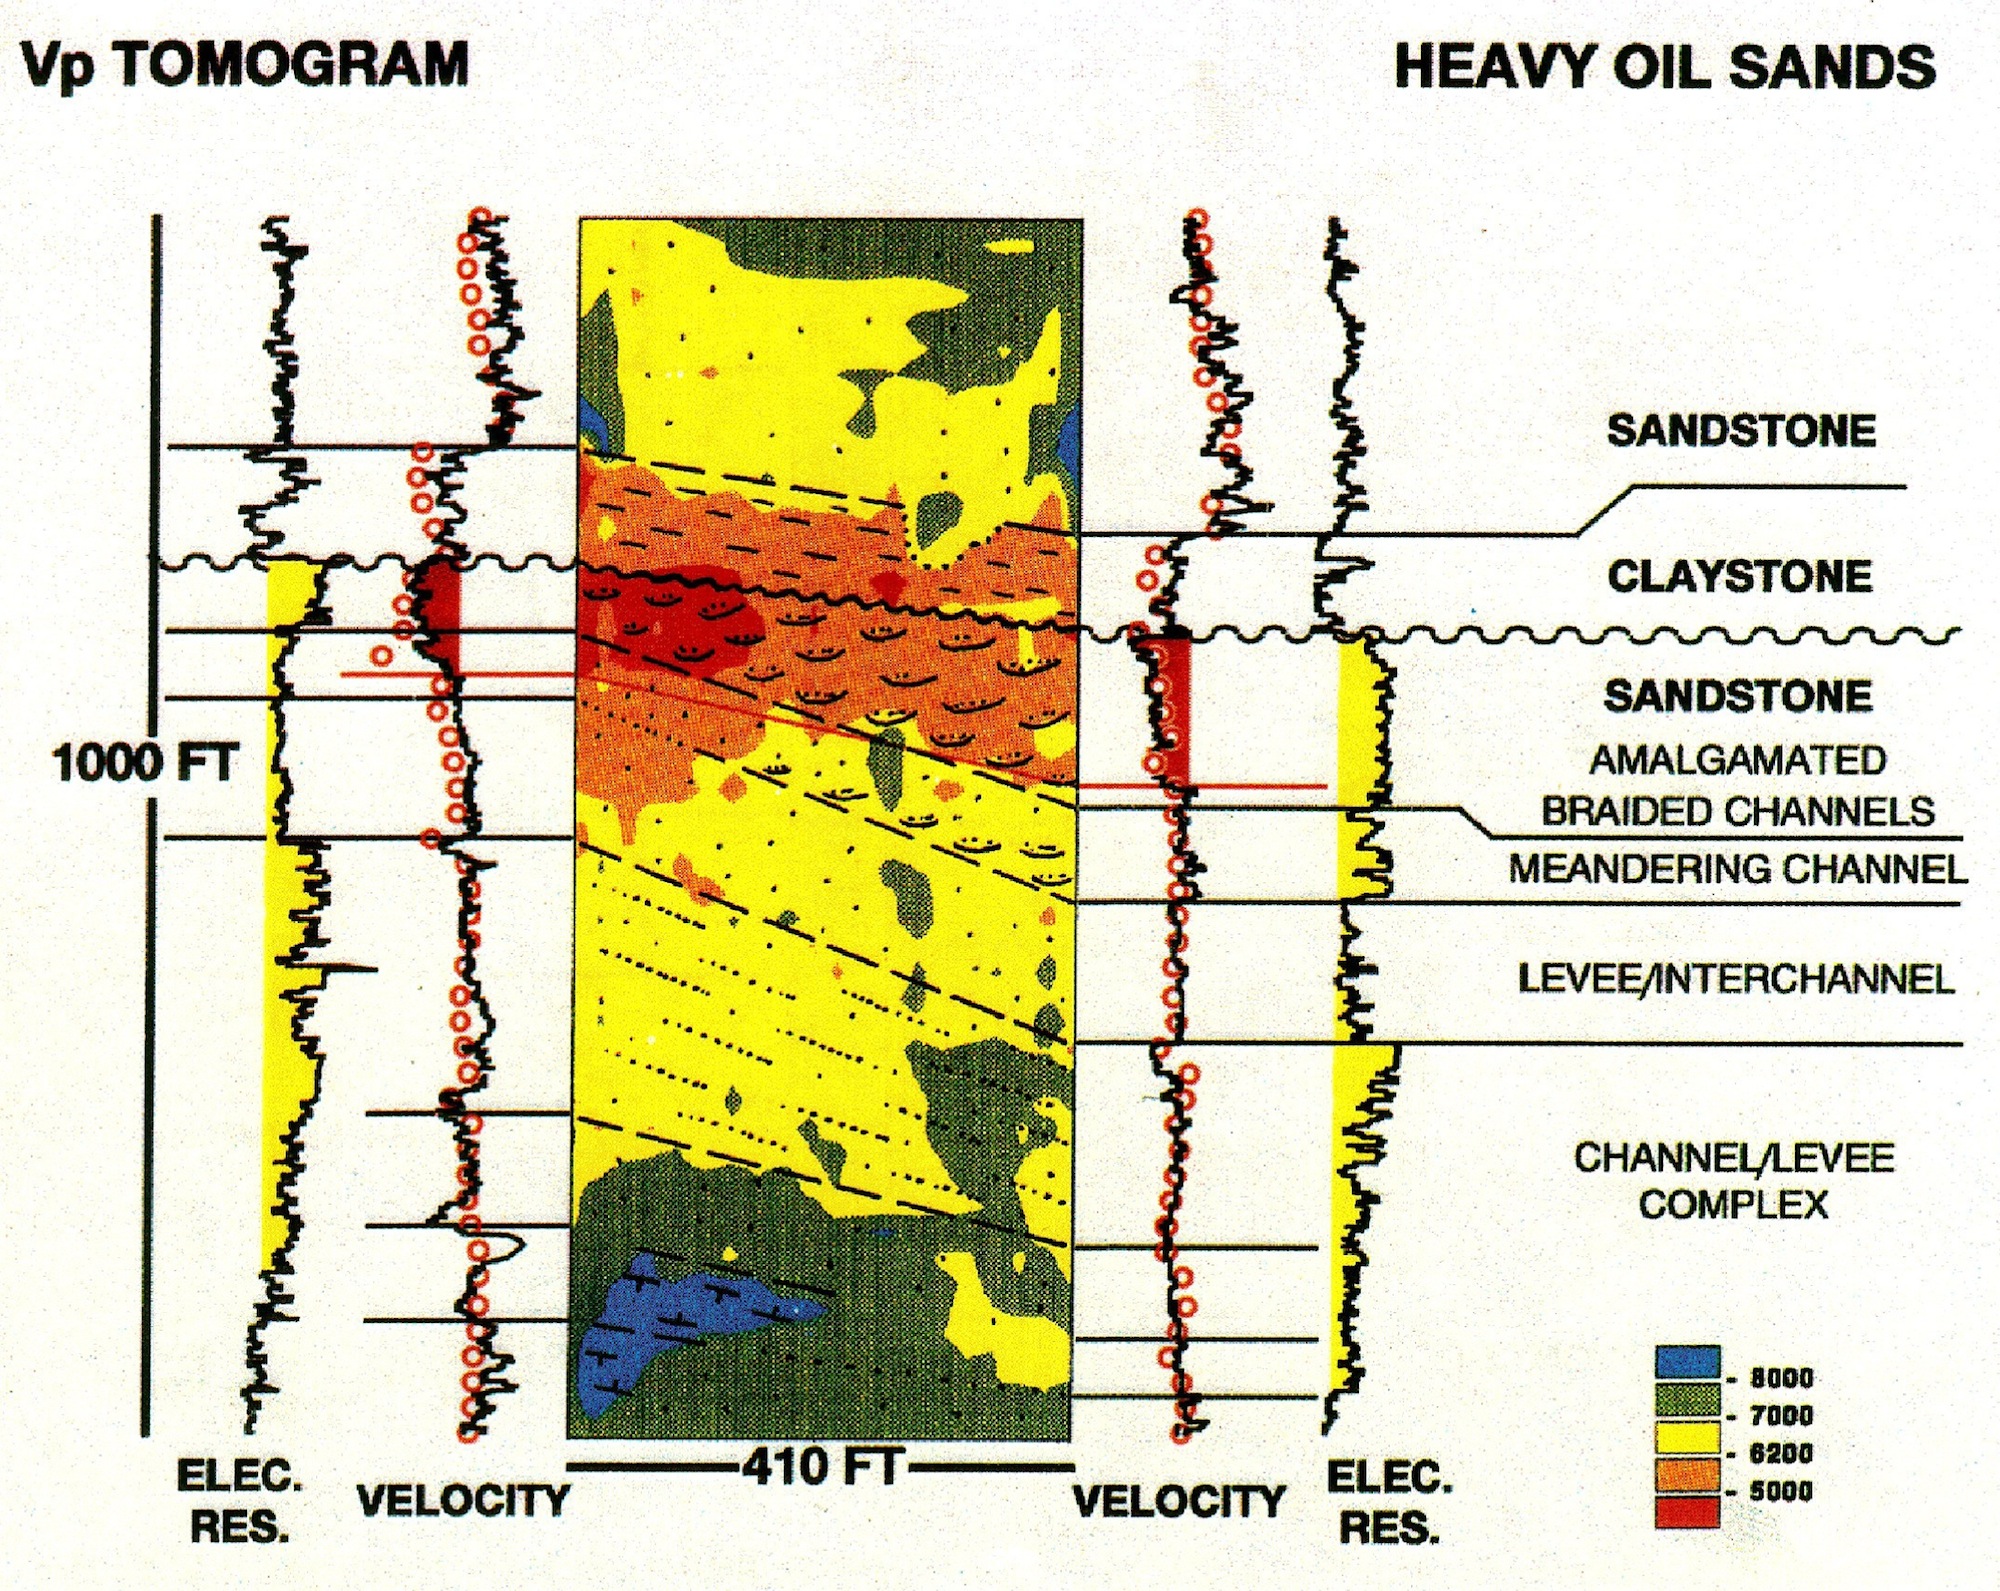
1.16 MB | Integrated data display documenting cross-borehole tomography interpretation across thermal EOR project. Log-defined stratigraphic units and fluid saturation zones correlate with tomographic velocity fields and provide the basis for interpretation of r... | 1 |
| 15:11, 14 August 2013 | Development-geology-reference-manual.png (file) |  |
361 KB | Cover image for Development Geology Reference Manual | 1 |
| 17:30, 19 December 2013 | Drive-mechanisms-and-recovery fig1.png (file) |  |
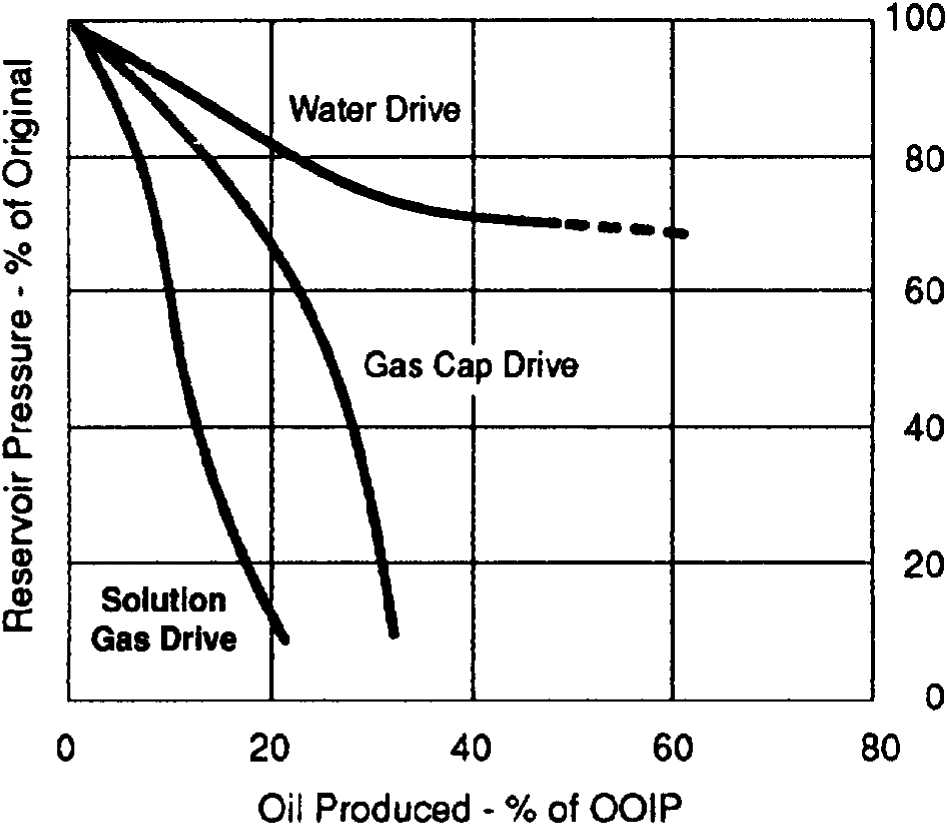
36 KB | {{copyright|AAPG}} Reservoir pressure trends by drive mechanism. Category:Reservoir engineering methods | 1 |
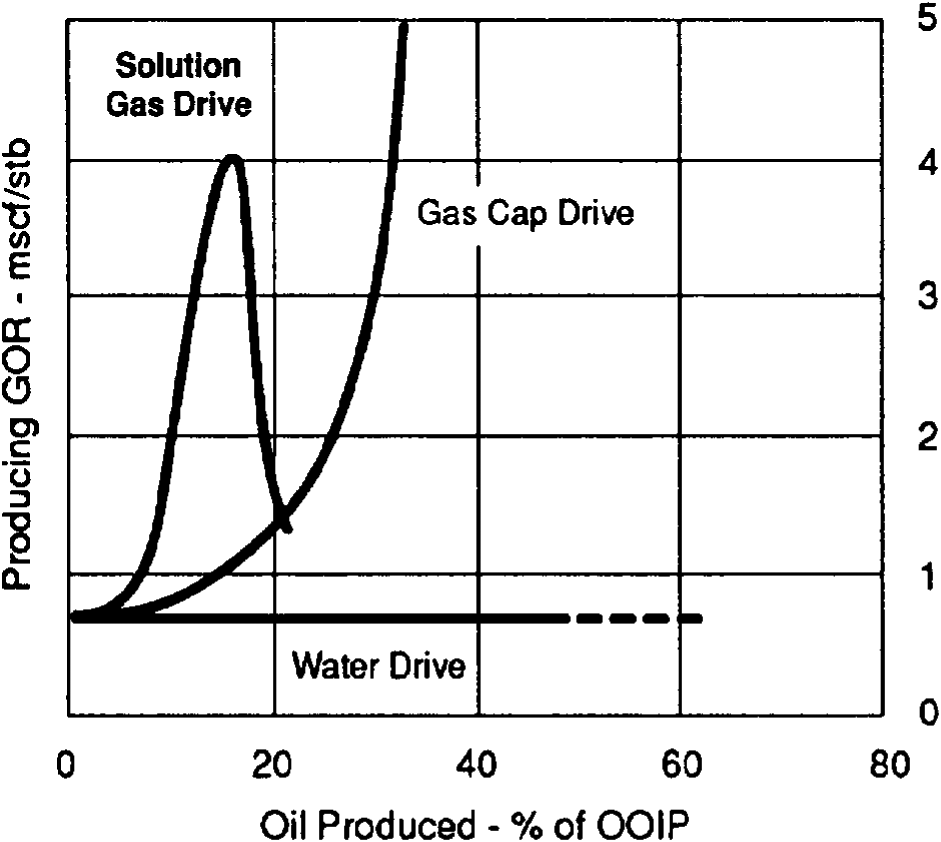
| 17:30, 19 December 2013 | Drive-mechanisms-and-recovery fig2.png (file) |  |
30 KB | {{copyright|AAPG}} Producing gas-oil ratio trends by drive mechanism. Category:Reservoir engineering methods | 1 |
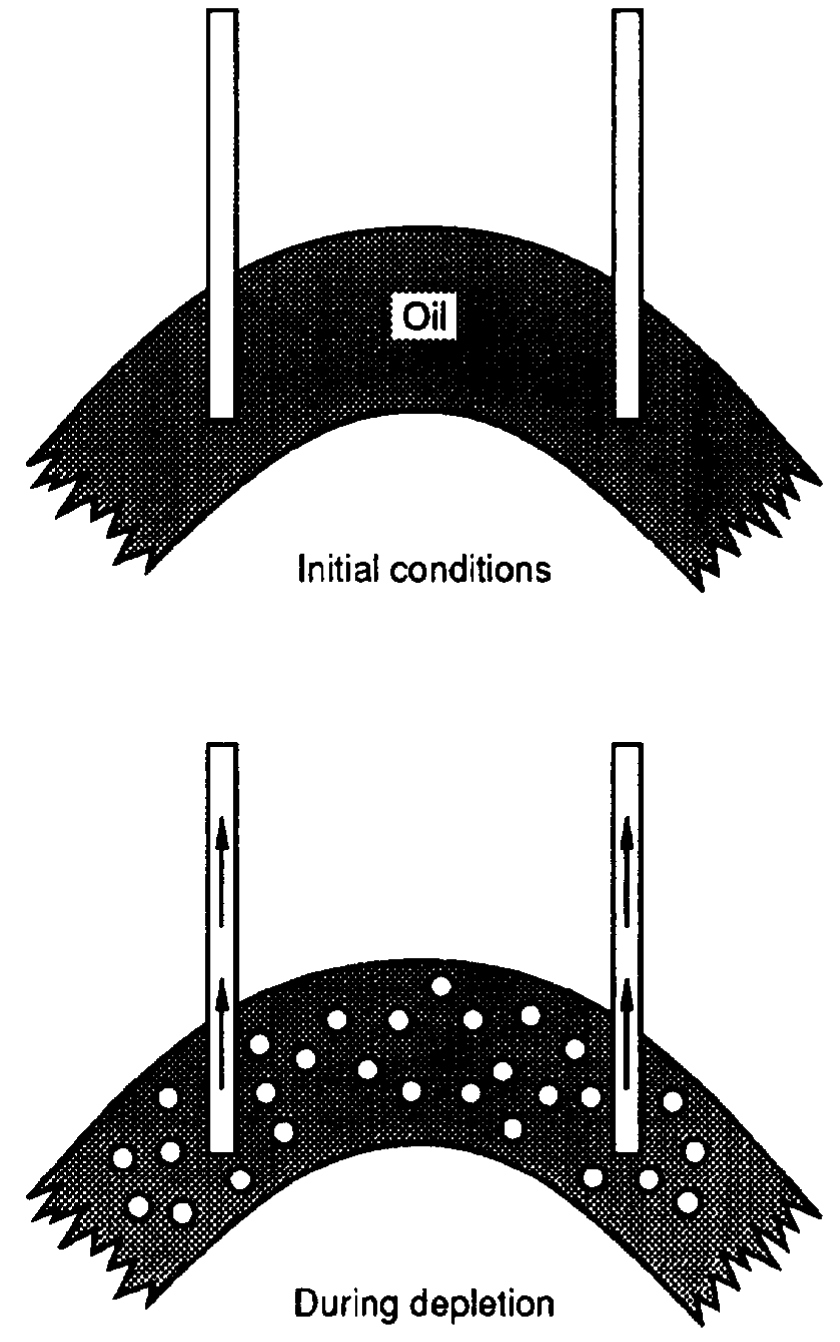
| 17:31, 19 December 2013 | Drive-mechanisms-and-recovery fig3.png (file) |  |
73 KB | {{copyright|AAPG}} Solution gas drive reservoir. Category:Reservoir engineering methods | 1 |
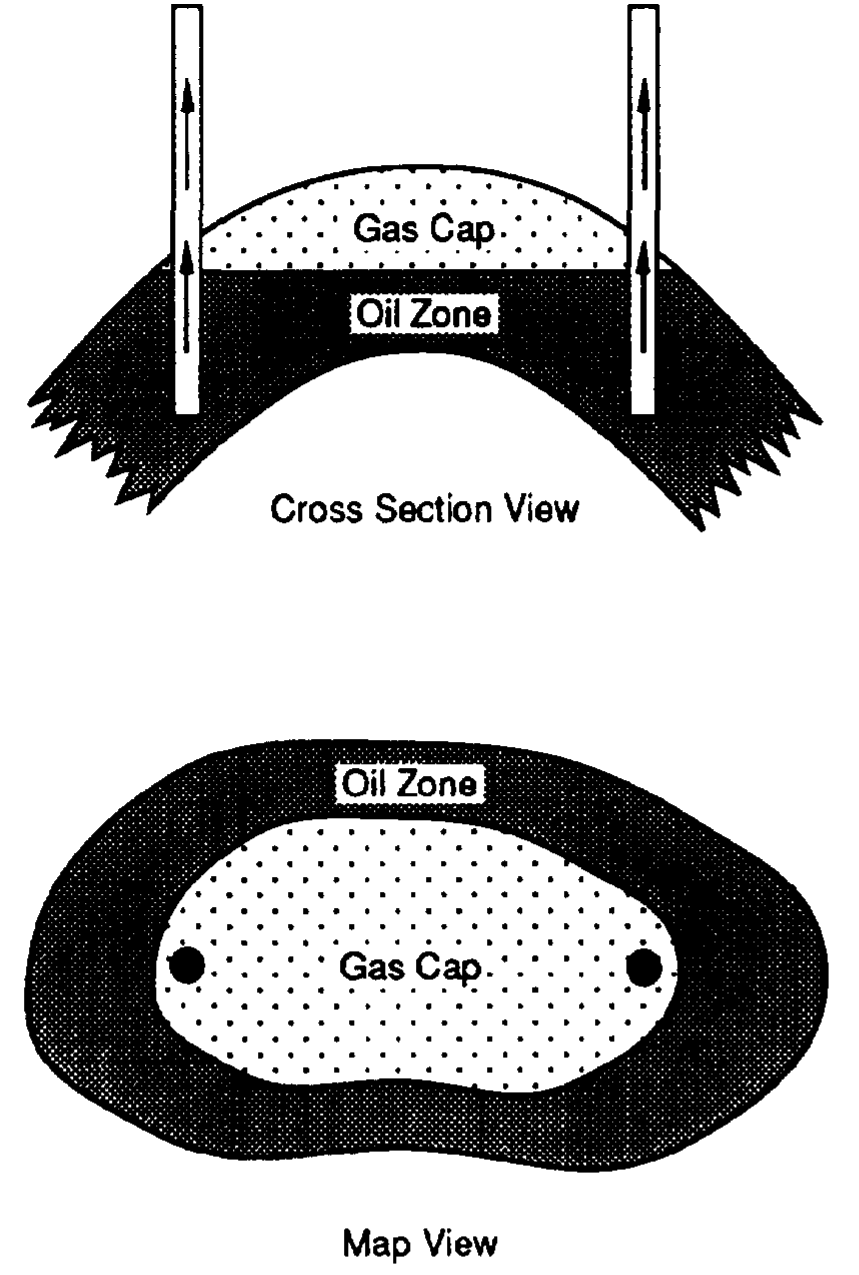
| 17:31, 19 December 2013 | Drive-mechanisms-and-recovery fig4.png (file) |  |
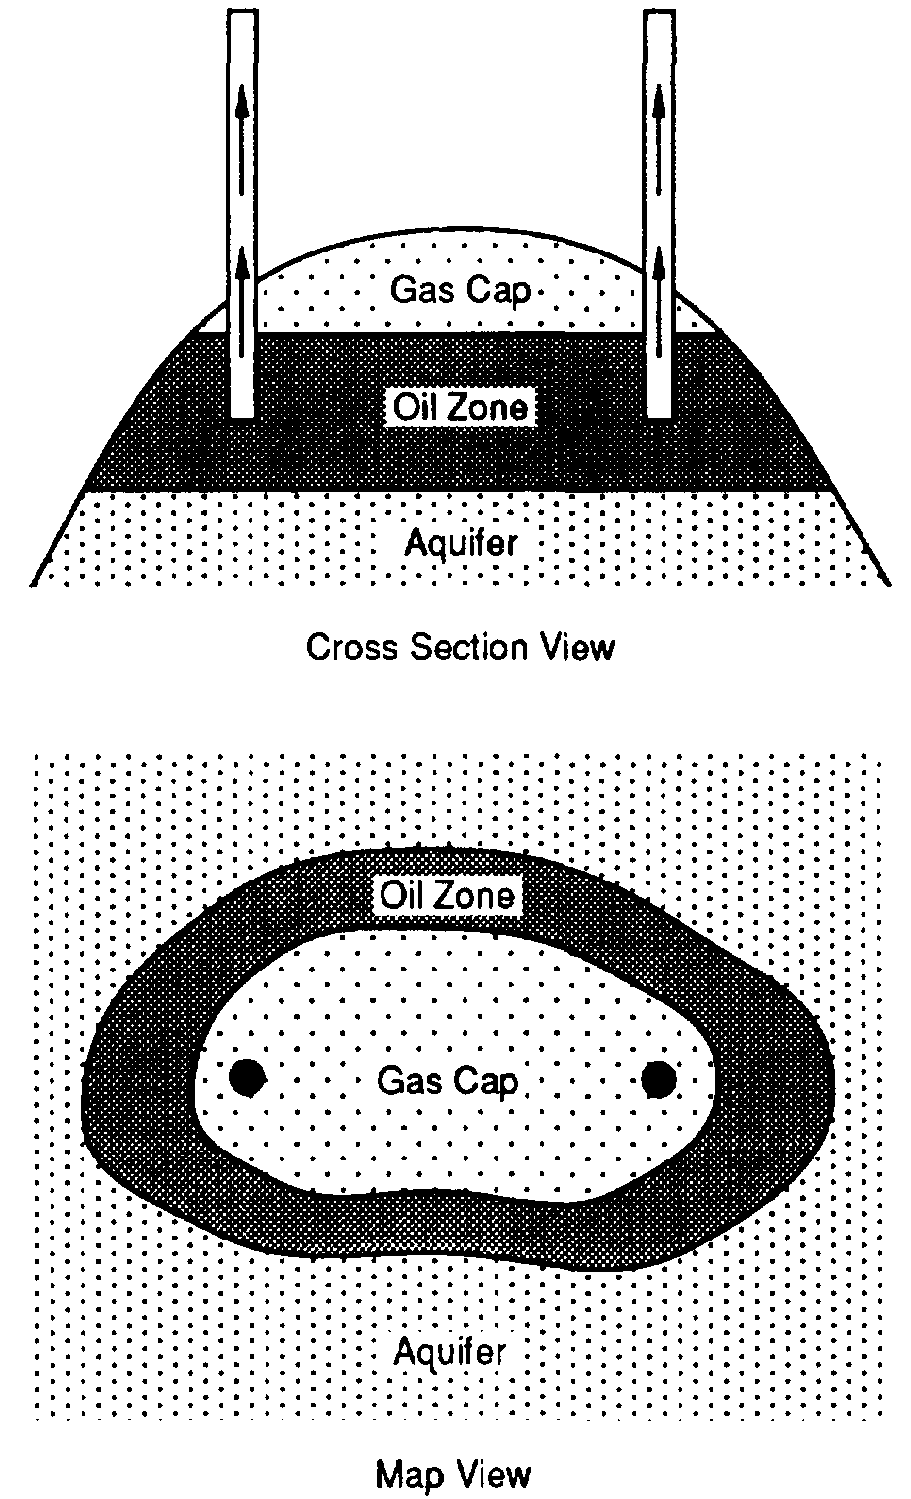
68 KB | {{copyright|AAPG}} Gas cap drive reservoir. Category:Reservoir engineering methods | 1 |
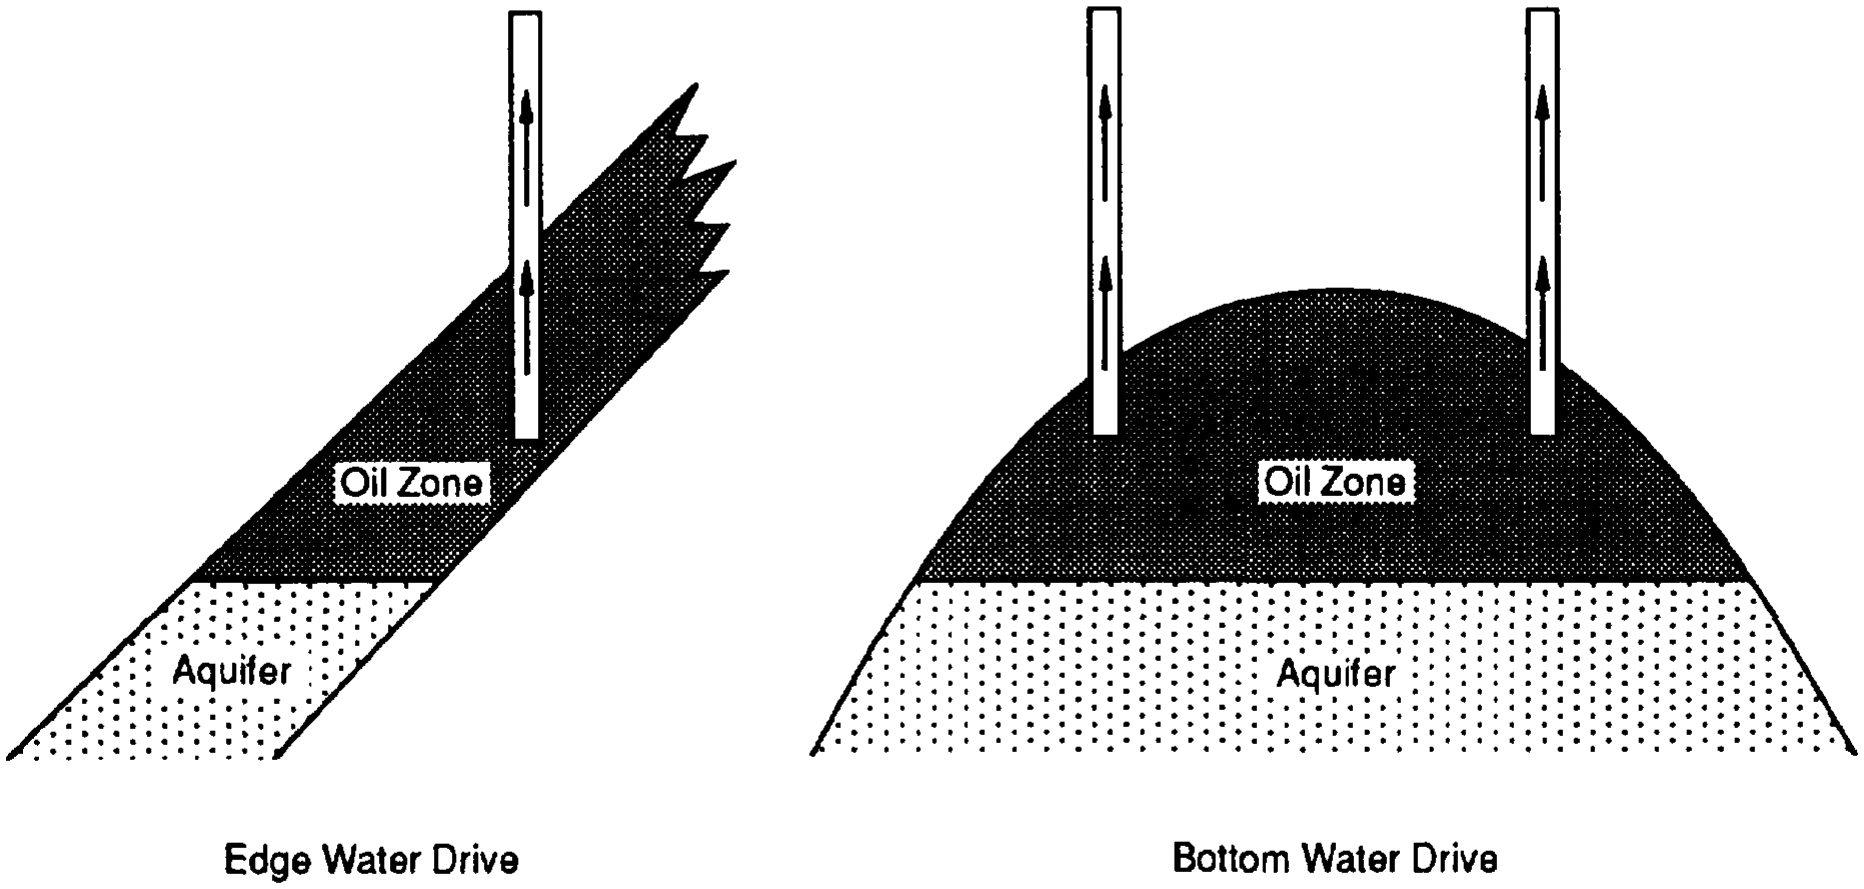
| 17:31, 19 December 2013 | Drive-mechanisms-and-recovery fig5.png (file) |  |
92 KB | {{copyright|AAPG}} Edge water versus bottom water drive reservoirs. Category:Reservoir engineering methods | 1 |
| 17:31, 19 December 2013 | Drive-mechanisms-and-recovery fig6.png (file) |  |
36 KB | {{copyright|AAPG}} Combination drive reservoir. Category:Reservoir engineering methods | 1 |
| 17:31, 19 December 2013 | Drive-mechanisms-and-recovery fig7.png (file) |  |
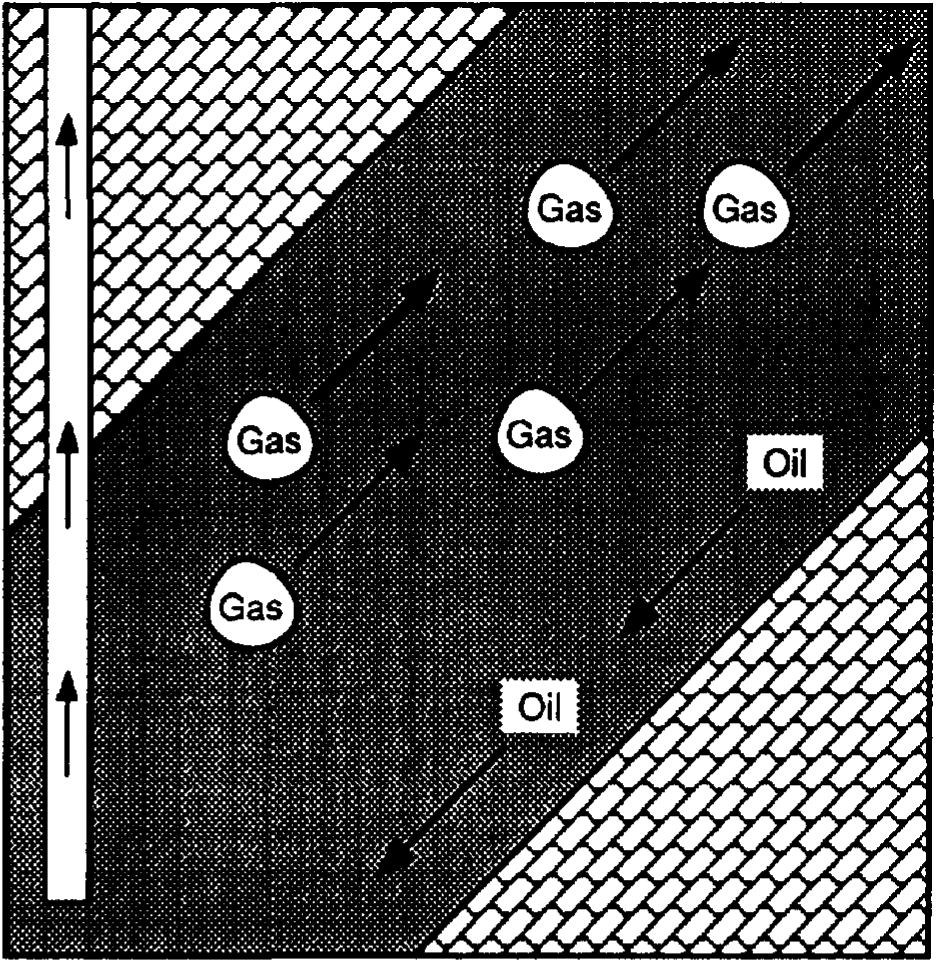
139 KB | {{copyright|AAPG}} Fluid segregation by gravity damage. Category:Reservoir engineering methods | 1 |
| 19:29, 21 January 2014 | Edit-copy green.svg (file) |  |
13 KB | Required for Documentation template; CC-BY-SA from Commons. | 1 |
| 16:21, 31 January 2014 | Evaluating-top-and-fault-seal fig10-20.jpg (file) |  |
1.54 MB | Category:Evaluating top and fault seal | 1 |
| 16:23, 31 January 2014 | Evaluating-top-and-fault-seal fig10-24.jpg (file) |  |
602 KB | Category:Evaluating top and fault seal | 1 |
| 16:17, 31 January 2014 | Evaluating-top-and-fault-seal fig10-28.jpg (file) |  |
1.01 MB | Category:Evaluating top and fault seal | 1 |
| 13:56, 17 January 2014 | Exploring-for-oil-and-gas-traps.png (file) |  |
109 KB | Book cover image. | 1 |
| 16:43, 23 January 2014 | Exploring-for-stratigraphic-traps fig21-38.jpg (file) |  |
1.34 MB | Category:Exploring for stratigraphic traps | 1 |
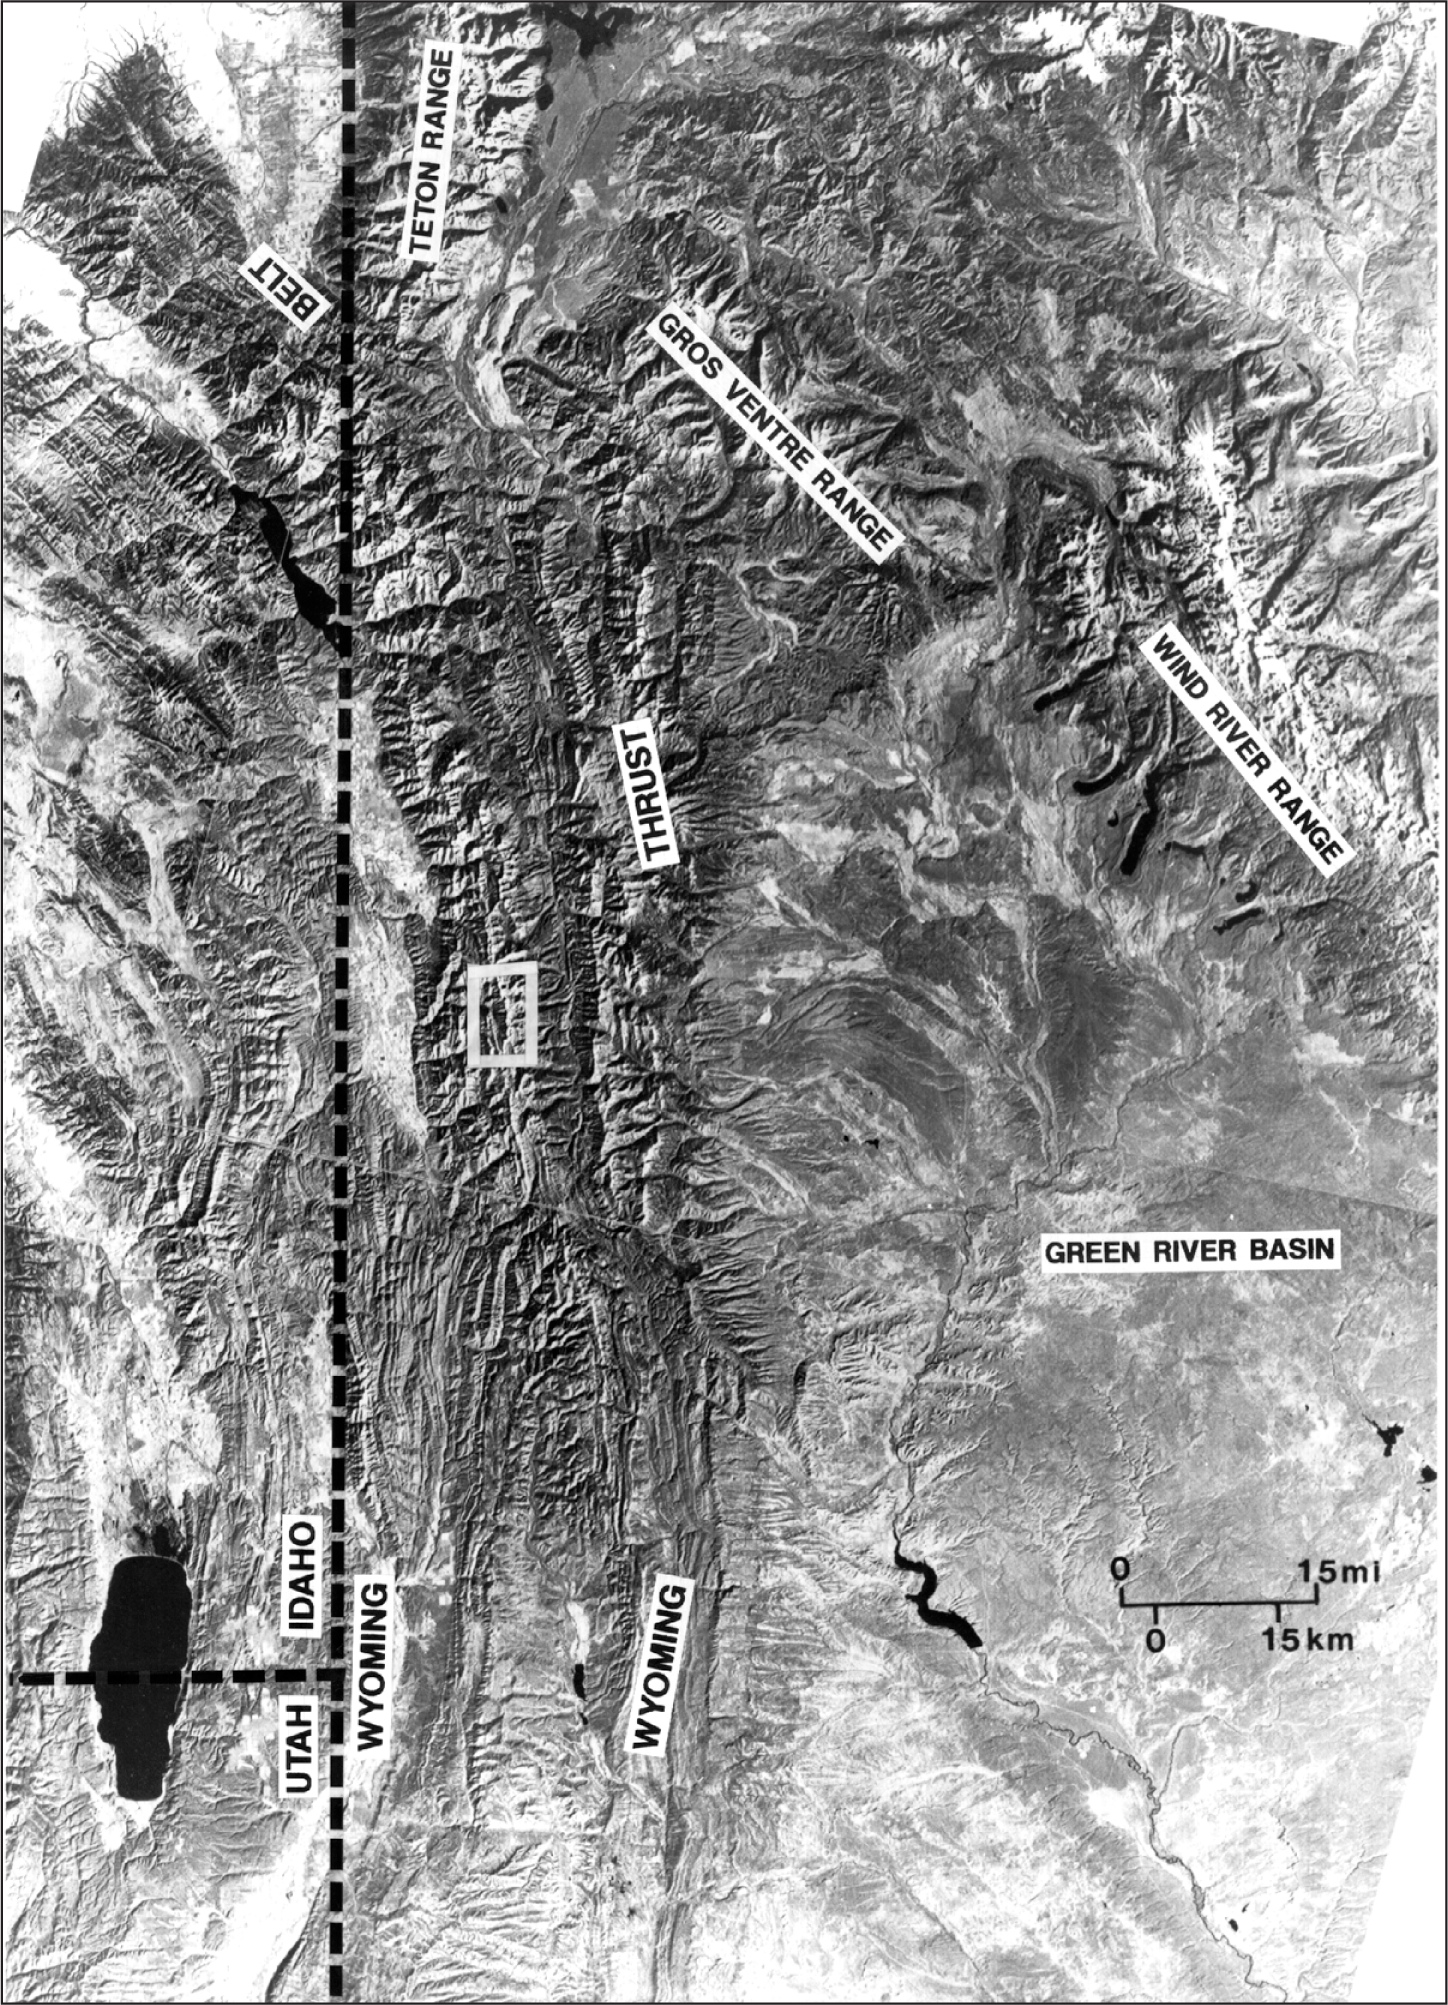
| 16:39, 22 January 2014 | Exploring-for-structural-traps fig20-16.jpg (file) |  |
1.44 MB | Category:Exploring for structural traps | 1 |
| 16:43, 22 January 2014 | Exploring-for-structural-traps fig20-6.jpg (file) |  |
1.56 MB | Category:Exploring for structural traps | 1 |
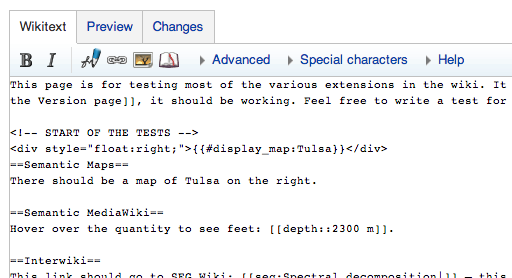
| 19:56, 17 March 2014 | Extension WikiEditor example.png (file) |  |
33 KB | Example of extension. | 1 |
| 15:36, 23 January 2014 | Extinction intensity.svg (file) |  |
89 KB | [http://en.wikipedia.org/wiki/File:Extinction_intensity.svg CC-BY-SA by Smith609] | 1 |
| 16:07, 30 January 2014 | Formation-fluid-pressure-and-its-application fig5-32.png (file) |  |
231 KB | Copyright Earth Science Reviews | 1 |
| 19:17, 22 January 2014 | GeoScienceWorld button.png (file) |  |
14 KB | For {{Tl|Search}} | 1 |
| 14:38, 6 August 2013 | Girl1.png (file) |  |
36 KB | iStockPhoto, licensed | 1 |
| 14:38, 6 August 2013 | Girl2.png (file) |  |
41 KB | iStockPhoto, licensed | 1 |
| 19:19, 22 January 2014 | Google button.png (file) |  |
9 KB | Improved alpha | 2 |
| 14:44, 6 August 2013 | Icon delete.png (file) |  |
42 KB | Crystal Clear icon, LGPL licensed | 1 |
| 14:06, 6 August 2013 | Icon ffwd.png (file) |  |
37 KB | Crystal Clear, LGPL | 1 |
| 14:44, 6 August 2013 | Icon goldstar.png (file) |  |
10 KB | Crystal Clear icon, LGPL licensed | 1 |
| 14:06, 6 August 2013 | Icon help.png (file) |  |
54 KB | Crystal Clear, LGPL | 1 |
| 14:06, 6 August 2013 | Icon news.png (file) |  |
48 KB | Crystal Clear, LGPL | 1 |
| 14:44, 6 August 2013 | Icon reload.png (file) |  |
11 KB | Crystal Clear icon, LGPL licensed | 1 |
| 14:06, 6 August 2013 | Icon rwd.png (file) |  |
34 KB | Crystal Clear, LGPL | 1 |