Search results
Jump to navigation
Jump to search
Page title matches
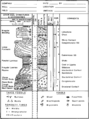
File:Core-description fig1.png (1,879 × 2,521 (232 KB)) - 22:38, 13 January 2014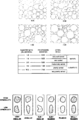
File:Core-description fig2.png (946 × 1,441 (37 KB)) - 22:38, 13 January 2014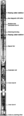
File:Core-orientation fig1.png Typical assembly for mechanically orienting core.(456 × 2,212 (76 KB)) - 22:38, 13 January 2014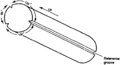
File:Core-orientation fig2.png (898 × 487 (8 KB)) - 22:38, 13 January 2014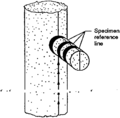
File:Core-orientation fig3.png (798 × 788 (11 KB)) - 22:38, 13 January 2014
File:Core-handling small.png (162 × 119 (34 KB)) - 13:17, 14 March 2014
File:Core-handling large.png (300 × 200 (98 KB)) - 19:02, 17 March 2014
File:Saskatchewan core storage facility.jpg (800 × 535 (252 KB)) - 16:48, 15 January 2014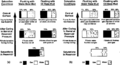
File:Core-alteration-and-preservation fig1.png ...e. (a)Oil-productive formation. (b) Gas-productive formation. (Courtesy of Core Laboratories, a Division of Western Atlas International}} ...e. (a)Oil-productive formation. (b) Gas-productive formation. (Courtesy of Core Laboratories, a Division of Western Atlas International.(1,954 × 1,054 (65 KB)) - 22:38, 13 January 2014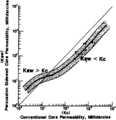
File:Overview-of-routine-core-analysis fig3.png ...e an indicated permeability greater than that determined from conventional core analysis. Sidewall cores from formations with more than 20 md permeability(945 × 979 (46 KB)) - 22:39, 13 January 2014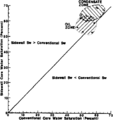
File:Overview-of-routine-core-analysis fig1.png ...shows that sidewall core values are almost always higher than conventional core values. Sample values from gas condensate zones are 10 to 15% higher, while(943 × 1,002 (17 KB)) - 22:39, 13 January 2014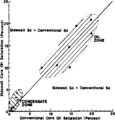
File:Overview-of-routine-core-analysis fig2.png ...y have measured oil saturation values that are 2% higher than conventional core samples. In oil zones the relationship is less clear. The agreement between(945 × 983 (19 KB)) - 22:39, 13 January 2014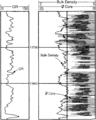
File:Core-log-transformations-and-porosity-permeability-relationships fig1.png Plot showing unshifted core porosity in spiked format, together with bulk density log.(938 × 1,169 (73 KB)) - 18:05, 14 January 2014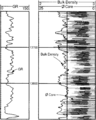
File:Core-log-transformations-and-porosity-permeability-relationships fig2.png Plot showing shitted core porosity, together with bulk density log.(931 × 1,163 (74 KB)) - 18:05, 14 January 2014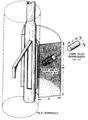
File:Core-log-transformations-and-porosity-permeability-relationships fig3.png ...rmation measured by the bulk density tool relative to that obtained from a core plug.(893 × 1,221 (82 KB)) - 18:05, 14 January 2014
File:Core-log-transformations-and-porosity-permeability-relationships fig4.png (941 × 890 (53 KB)) - 18:06, 14 January 2014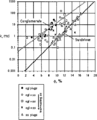
File:Core-log-transformations-and-porosity-permeability-relationships fig5.png (912 × 1,127 (19 KB)) - 18:06, 14 January 2014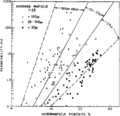
File:Core-log-transformations-and-porosity-permeability-relationships fig6.png (934 × 903 (17 KB)) - 18:06, 14 January 2014


Page text matches
File:MainPageFG18CoreSt63Appendix3.jpg ...Permian) field, Permian Basin, Texas: AAPG Studies in Geology 63. Used on Core description article.(400 × 400 (104 KB)) - 16:14, 29 June 2015File:Overview-of-routine-core-analysis fig3.png ...e an indicated permeability greater than that determined from conventional core analysis. Sidewall cores from formations with more than 20 md permeability(945 × 979 (46 KB)) - 22:39, 13 January 2014File:Overview-of-routine-core-analysis fig1.png ...shows that sidewall core values are almost always higher than conventional core values. Sample values from gas condensate zones are 10 to 15% higher, while(943 × 1,002 (17 KB)) - 22:39, 13 January 2014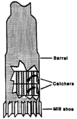
File:Fishing fig6.png Core type basket.(665 × 1,029 (75 KB)) - 01:50, 14 January 2014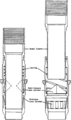
File:Conventional-coring fig3.png Full-closure core catcher. (From Whitebay, 1986.)(866 × 1,469 (66 KB)) - 22:38, 13 January 2014File:Core-orientation fig1.png Typical assembly for mechanically orienting core.(456 × 2,212 (76 KB)) - 22:38, 13 January 2014File:Core-log-transformations-and-porosity-permeability-relationships fig2.png Plot showing shitted core porosity, together with bulk density log.(931 × 1,163 (74 KB)) - 18:05, 14 January 2014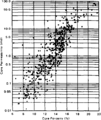
File:Conducting-a-reservoir-simulation-study-an-overview fig4.png Core measurements from the Bradford Sandstone. (From Levorsen, 1967.)(926 × 1,100 (24 KB)) - 18:46, 14 January 2014File:Core-log-transformations-and-porosity-permeability-relationships fig1.png Plot showing unshifted core porosity in spiked format, together with bulk density log.(938 × 1,169 (73 KB)) - 18:05, 14 January 2014
File:Reservoir-modeling-for-simulation-purposes fig2.png Analysis of core data for facies identification and rock quality assessment.(1,955 × 545 (75 KB)) - 14:35, 14 January 2014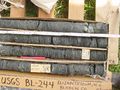
File:Box core32.jpg Box of core samples, labelled and stored on site, USGS Coastal Carolina Project 2003 -(800 × 600 (63 KB)) - 20:50, 30 June 2014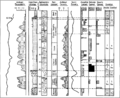
File:Evaluating-diagenetically-complex-reservoirs fig4.png ...raph displaying geological and petrophysical parameters of a well based on core description.(1,980 × 1,622 (338 KB)) - 18:46, 14 January 2014File:Core-alteration-and-preservation fig1.png ...e. (a)Oil-productive formation. (b) Gas-productive formation. (Courtesy of Core Laboratories, a Division of Western Atlas International}} ...e. (a)Oil-productive formation. (b) Gas-productive formation. (Courtesy of Core Laboratories, a Division of Western Atlas International.(1,954 × 1,054 (65 KB)) - 22:38, 13 January 2014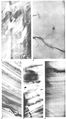
File:M31F27.jpg ...uctures in mudflow deposit that caps a slump block. E. X-ray radiograph of core in normally deposited marine clays, which often cap the slump deposits. ote(760 × 1,372 (583 KB)) - 18:23, 18 August 2014File:Core-log-transformations-and-porosity-permeability-relationships fig3.png ...rmation measured by the bulk density tool relative to that obtained from a core plug.(893 × 1,221 (82 KB)) - 18:05, 14 January 2014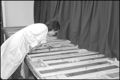
File:M91Ch6FG40.JPG Museum core on display. From Shepherd, M., 2009, Sources of data, in M. Shepherd, Oil f(600 × 402 (45 KB)) - 16:55, 3 June 2015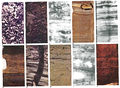
File:M31F7.jpg ...s and peat deposits are common in this environment. I. X-ray radiograph of core taken in backswamp deposit. Note the stringers of organic debris (dark laye(1,366 × 1,004 (1.31 MB)) - 19:50, 15 August 2014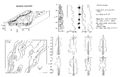
File:M31F3.jpg ...tics of braided channel deposits (letters on the vertical section refer to core or outcrop photographs). From Deltaic environments of deposition, 1981, Col(2,941 × 1,884 (830 KB)) - 19:02, 15 August 2014
File:FG18CoreSt63Appendix3.JPG Core slab photo. From Ruppel, Stephen C., 2012, Appendix 3, in S. C. Ruppel, ed.(600 × 890 (315 KB)) - 16:10, 29 June 2015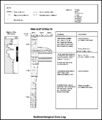
File:M91Ch6FG42.JPG Example of a sedimentological core log, Well d-2-C/94a-16, Peejay field, Canada (after Caplan and Moslow, 1999(800 × 942 (95 KB)) - 17:04, 3 June 2015


