Data: sources
THIS PAGE IS UNDER CONSTRUCTION
| Oil Field Production Geology | |

| |
| Series | Memoirs |
|---|---|
| Part | The Geological Scheme |
| Chapter | Sources of Data |
| Author | Mike Shepherd |
| Link | Web page |
| PDF file (requires access) | |
| Store | AAPG Store |
A large amount of data is available to the production geologist for reservoir evaluation. Much of the data will have been expensive to acquire, particularly if obtained from wells offshore. For instance, core taken from a drilling operation on an offshore drilling rig may have cost more than a million dollars to recover. There is an obligation to take good care of the data and to make sure that the information is accessible, either as well-organized paper data files or as data on a computer shared drive. Data files stored on a computer should be labeled with the originator's initials, a date, and some idea of the significance of the data, e.g., "MS August 31, 2008, final top reservoir depth map." Well files should be compiled with all the available data collected on a well-by-well basis. Good data management can make all the difference between a project that is well organized and effective, and one that is disorganized and inefficient.
Obtaining data in an oil field environment is expensive; therefore, it is necessary to justify the economics of gathering the information. In the early stage of field life, the value of information is enormous; the data are essential for reservoir evaluation. Later on in field life, it becomes more important to justify the expense of the data. The new information should be gathered on the basis that it significantly improves the project value and reduces the company's investment risk.[1]
Types of data
A production geologist will use data from a variety of sources. These include:
- mud logging data
- core data
- sedimentology and petrography reports
- outcrop analogs/modern depositional environments
- wireline-log and logging-while-drilling (LWD) data
- production-log data
- well-test data
- fluid samples
- production data
- seismic data
Mud logging data
The mud loggers on the rig site will monitor the drilling parameters during the well operation, and these are summarized graphically as a mud log. The mud log will include a lithology log. This is a depth plot showing in graphical form the percentage of the various lithologies in each cutting sample recovered while drilling the wellbore. A written description will be made for the lithology of the drill cuttings. Accompanying the lithology log is a record of the rate of penetration of the drill bit. This is an indication of lithology; sandstone is normally drilled faster than shale for instance. Any drilling problems encountered or changes in the drilling parameters will be reported in the margins of the mud log. The presence of oil shows will be noted. The gas returns and gas chromatography analysis are monitored and graphed against depth. High gas returns are a sign that a hydrocarbon reservoir may have been drilled. Significant concentrations of the higher alkanes on the gas chromatograph can indicate that an oil zone has been penetrated. The mud log is used as a first pass, qualitative indication of reservoir presence and quality. A more detailed and accurate representation will be available once wireline logs have been run and interpreted.
The mud loggers also collect bags of rock cutting samples at regular intervals while the well is being drilled. These may be used later for biostratigraphic and lithological analysis.[2]
Core data
The geologist uses core data to provide a sedimentological description and rock property analysis for input to the geological model. Specialist service companies perform the core analysis. Rock properties such as porosity and permeability are measured on core plugs cut from the core. These are about 2.5 or 3.8 cm (1 or 1.5 in.) in diameter and about 2.5–5 cm (1–2 in.) long. The plugs are cut horizontally (i.e., bed parallel) at a frequency of three to four samples per meter or every foot for oil companies that use imperial measurements (Monicard, 1980). Vertical core plugs may also be cut every 1.5 m (5 ft) for example. On occasions, large pieces of full-diameter core are used for measuring rock properties instead of small core plugs. This can be a more meaningful way of establishing the reservoir characteristics for the more complex lithologies such as carbonates.
Other members of the subsurface team will also use the core data. The petrophysicist uses core data to calibrate the measurement of rock properties from wireline log data. The reservoir engineer obtains data for the various reservoir parameters needed to understand the physics of fluid distribution and flow. Properties such as capillary pressure and relative permeability are measured by special core analysis, and this is referred to by the acronym SCAL. The geologist will frequently get requests from the production engineer to provide core samples for laboratory tests. The aim is to ensure that the various downhole chemical treatments do not react with the rock or the pore fluid to plug up the pore space and impair productivity.
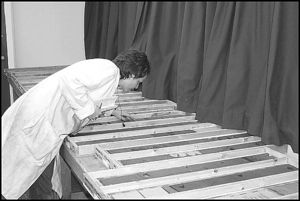
The core is slabbed once all the samples have been taken and the measurements are complete. It will be cut into three vertical sections down the length of the core. The middle slab is kept as a reference core for further study by the geologist. It is placed in a wooden frame and set in resin or glued to a firm base. This part of the core will be kept as a museum core (Figure 1). The other two sections of the core, referred to as the half cut, are kept for subsequent sampling.
Coring problems
Representative cores should be taken from wells throughout the field. The aim should be to have key areas of the field covered. Ideally, all the various reservoir units should be cored. The entire reservoir interval should be cored in at least one well if practical.
Cores are commonly taken at the exploration and appraisal stage, although some of the early production wells may also be cored. It is unusual to take core at the mature stage of field development; however, there may be reasons for doing this if the value of information can be justified.
Core analysis reports
The core analysis company will provide two reports once a job has been completed. The first is the core analysis report. This can include the following data: horizontal permeability, vertical permeability, porosity, water saturation, oil saturation, grain density, and sometimes a brief description of the core plug lithology (Table 1). A listing will be provided on a foot by foot basis (or its metric equivalent) of the rock properties measured in the lab (Table 2).
| Core data | What it means |
|---|---|
| Permeability | The measure of the ease of movement of fluid through the pore space in a rock. |
| Horizontal permeability | Core plugs are cut parallel to the bedding planes in the core, and the horizontal permeability values are measured from these. |
| Vertical permeability | A lesser amount of core plugs is cut orthogonal to the bedding planes in the core, and the vertical permeability values are measured from these. |
| Porosity | The decimal fraction or percentage of the void (pore) space volume within the rock to the total rock volume. |
| Water saturation | The decimal fraction or percentage of the total volume of water relative to the total volume of fluid (hydrocarbon plus water) in the pore space. |
| Oil saturation | The decimal fraction or percentage of the total volume of oil relative to the total volume of fluid in the pore space. |
| Grain density | The density of the constituent grains making up the sediment in the core plug. |
| Core 1 2244.80-2300.10 m (7364.82-7546.25 ft) Drilled Depth | |||||||
|---|---|---|---|---|---|---|---|
| Sample | Depth | KH1 | KV2 | CPOR3 | CSO4 | CSW5 | RHOG6 |
| 1 | 2244.95 | 838.00 | - | 15.7 | 52.30 | 3.4 | 2.65 |
| 2 | 2245.24 | 2180.00 | - | 16.1 | 46.20 | 3.3 | 2.64 |
| 3 | 2245.51 | 995.00 | - | 15.0 | 50.30 | 3.6 | 2.64 |
| 4 | 2245.78 | 766.00 | - | 14.9 | 48.50 | 3.5 | 2.65 |
| 5 | 2246.25 | 165.00 | - | 12.2 | 41.20 | 10.2 | 2.65 |
| 6 | 2246.50 | 474.00 | 390.00 | 15.9 | 51.50 | 3.4 | 2.65 |
| 7 | 2246.95 | 521.00 | - | 15.3 | 42.60 | 8.1 | 2.64 |
| 8 | 2247.75 | 260.00 | - | 12.4 | 49.70 | 7.2 | 2.65 |
| 9 | 2248.05 | 374.00 | - | 15.7 | 52.40 | 6.8 | 2.64 |
| 10 | 2248.25 | 88.90 | - | 14.1 | 50.10 | 10.2 | 2.65 |
| 11 | 2248.45 | 42.20 | - | 10.9 | 49.70 | 8.2 | 2.65 |
| 12 | 2250.42 | 672.00 | - | 15.3 | 51.30 | 1.2 | 2.65 |
| 13 | 2250.75 | Preserved sample | |||||
| 14 | 2300.00 | 76.30 | - | 9.5 | 47.90 | 5.6 | 2.54 |
1 = horizontal permeability to air (md.) 2 = vertical permeability to air (md). 3 = core porosity (%). 4 = core oil saturation (%). 5 = core water saturation (%). 6 = grain density (g/cm3).
The depths at which preserved core samples have been picked will also be listed. These are selected pieces of core that are kept to preserve the conditions of the rock as close to those in the reservoir as possible. They may be required for special core analysis such as wettability studies.[4] One preservation method is to store the samples in sealed jars containing simulated formation brine.
A core gamma log will also be included in a core analysis report. The gamma-ray response is measured along the length of the core in the laboratory. It is used to match up the core depths to the depths on the wireline gamma-ray log run over the cored interval in the reservoir. These can differ from about half a meter to sometimes more than 6 m (18 ft). This is because over a distance of 2000 or 3000 m (6500 or 10,000 ft) within the borehole, the drill string to which the core barrel is attached will stretch under tension a few meters more or less than the wireline to which the log is attached. Also, incomplete recovery of core, particularly unconsolidated core, can lead to discrepancies in the core log. Comparison of the core gamma with the wireline gamma log allows the core-to-log shift to be determined. This is important for matching features in the core to the equivalent log response.
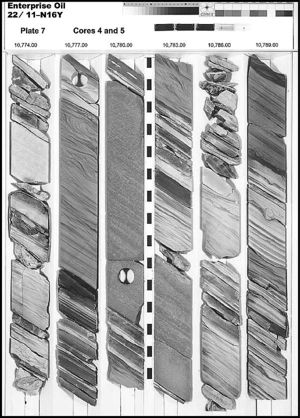
The second report received is the core photography report (Figure 2). This is a set of color photographs of the slabbed core. The geologist can keep this in the office as a substitute for a trip to the core storage location to see the actual rock. If any oil is present in the core, the core will also be photographed under ultraviolet light. Any oil-saturated intervals will show up as fluorescent patches on the photographs.
The sedimentology report
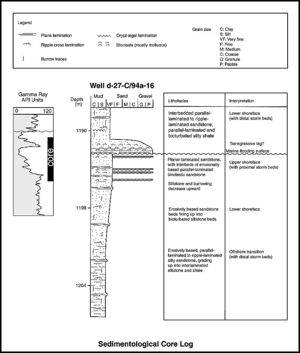
It is good practice to call in an expert sedimentologist to look at the core and to provide a detailed sedimentological report. The report will include a sedimentological log with a detailed description of all the sedimentological features seen in the core (Figure 3). Various details will be noted.[6]
These include:
- lithology with graphical lithology column
- graphical representation of grain size variation
- accessory minerals and diagenetic cement
- fossils
- diagenetic features
- sedimentary structures
- bioturbation
- nature of bed contacts
- sedimentary texture
- color
- oil staining
- grain sorting
- induration
- lithofacies
- fractures, faults, and other structural features
A written account of the detailed facies description and interpretation will be provided. Interpretations are made as to the likely sedimentary environment of deposition. A summary of the mineralogy, petrography, porosity types, and diagenetic mineralogy should also be included. The pore scale is also important for the production geologist, especially for an understanding on permeability controls and as to whether there are significant amounts of clay minerals that could potentially cause formation damage during production operations (see Problem wells). The report should include facies photographs, thin section photomicrographs, and, where appropriate, scanning electron microscopy (SEM) photomicrographs.
Wireline and LWD logs
Wireline logs are run in wells to determine the physical properties of the rock and fluids in the borehole (Table 3). From this, a detailed interpretation can be made of the geology and fluid saturations in the reservoir interval. A brief summary of these logs is provided here. For more details, the textbooks by Serra,[7] Rider,[8] and Luthi[9] can be consulted.
| Log | How it works | What it is used for |
|---|---|---|
| Gamma ray log | Measures the natural gamma-ray response of the rock | Well-log correlation, lithology identification; ideal for recognizing shales |
| Spectral gamma-ray log | As above, but with a more sensitive detector to pick out the individual contribution of potassium thorium, and uranium to the gamma-ray response | Knowledge of potassium, thorium, and uranium variation in the rocks can be useful for evaluating mineralogy and depositional environments |
| Spontaneous potential log | Measures the potential difference driving the electrical current, that results from salinity differences between the drilling mud and formation water in permeable rocks downhole | Gives a rough indication of lithology and is used for the evaluation of formation water resistivity |
| Electrical logs | Measures the electrical properties of the fluid in the rock | Can indicate if hydrocarbons are present or not |
| Density and neutron logs | Measures the formation density and volume of fluids in the rock, respectively | An estimate of porosity can be made; also allows the identification of certain lithologies such as limestone, anhydrite, and halite |
| Sonic log | Measures how fast an acoustic signal can pass through a rock | An estimate of porosity can be made; also used for seismic calibration |
| Nuclear magnetic resonance log | Determines the nuclear magnetic response of the fluids in the rock | provides data that allows porosity and permeability to be estimated |
| Dipmeter logs | Measures the electrical or sonic response of the rocks around the borehole | Used to calculate formation dip, pick out faults and other structures, and sometimes determine the sedimentary structure for paleocurrent analysis |
| Borehole image logs | Measures a detailed profile of the electrical or sonic response of the rocks in the borehole | Gives an indication of hole conditions that can affect the reliability of the log responses |
| Caliper log | Measures the diameter and shape of the borehole | Gives an indication of hole conditions that can affect the reliability of the log responses |
| Wireline coring including sidewall coring tool | Takes several short core plugs from the borehole wall | Lithological determination and rock sampling for biostratigraphy |
| Checkshot and vertical seismic profile log | Measures velocity data at specific borehole depths | Used to calibrate the seismic response |
| Formation tester log | Measures pressures at specific points in the reservoir and can allow small volumes of fluid to be sampled | Establish a pressure profile for the reservoir and define fluid contacts |
Gamma-ray logs
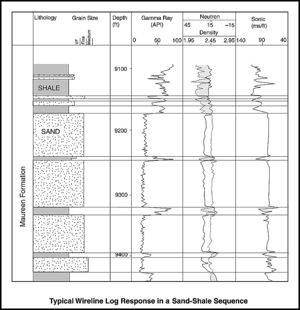
A gamma-ray log measures the natural radiation in the rocks, much of which is emitted by the elements potassium, uranium, and thorium (Figure 4). The geologist typically uses the log to differentiate between sandstone and shale for correlation purposes. Sandstones normally show a lower gamma-ray response than shales. The gamma ray is an excellent tool for this, providing it is used in conjunction with other logs to confirm the lithology response. Care should be taken with the interpretation of the gamma-ray log in some sandstones. Sandstones rich in potassium-rich minerals such as potassium feldspar, muscovite mica, illite, or glauconite can give a high gamma response that is easily mistaken for a shale. A gamma spike at the base of a sand-prone upper shoreface profile can be the result of concentrations of heavy, radioactive accessory minerals by wave winnowing.
Spectral gamma-ray logs
Spectral gamma-ray logs measure the relative contribution of potassium, thorium, and uranium to the overall gamma-ray response. A high potassium content generally indicates the presence of minerals such as potassium feldspar and mica. Thorium is associated with the mineral monazite, a common heavy mineral in sandstones sourced from acid igneous rocks.[11] Uranium is commonly found absorbed onto organic material and clay in marine shales.[7]
Spectral gamma-ray logs are used less frequently than the other types of log, although in certain situations they can pick out features that the other logs will not.[12] For example, the spectral gamma-ray log response can be used to identify a zone of potassium feldspar dissolution in leached sandstone below an unconformity.
Density and neutron logs
Density and neutron logs are primarily used for estimating the porosity. Density logs measure the bulk density of a formation, a function of the rock matrix density emitted from the log and the density of the fluids in the pore space, according to the degree by which the energy of gamma rays is progressively absorbed and scattered by electrons in the rock. The principle behind the density log is that, for a rock with a given grain and fluid density, the higher the porosity, the less dense the formation will be. A neutron log bombards the formation with neutrons to detect energy changes as a result of collisions with hydrogen atoms. Hydrogen is found in the water (and oil) molecules filling the pore space. Thus the neutron log gives an indication of the formation porosity.[8]
The logs also have specific geological uses. They can be used to pick out cemented intervals in sandstones. Carbonate-cemented intervals will show a distinctive response on these logs.
Sonic logs
A sonic log measures the time it takes for a sound pulse to travel from a transmitter to a receiver via the formation.[8] Sonic logs can be used for measuring porosity but are more commonly used by the geophysicist as they give velocity information for calibrating seismic data. Velocity data allow the geophysicist to convert the time taken for a seismic wave to travel down and back from a specific seismic reflector into an equivalent subsurface depth. The geologist can use sonic logs to pick out coals and poorly consolidated sandstones.
Electrical logs
Electrical logs measure the resistivity of the rock and its contained fluids to the passage of an electrical current.[8] A high-resistivity response within a porous rock is an indication of hydrocarbons. The logs can also help to recognize certain lithologies. Tight cemented intervals will have a high-resistivity response and these can be picked out in combination with the density and neutron log response.
Nuclear magnetic resonance logs
Nuclear magnetic resonance (NMR) logs measure how hydrogen nuclei in a static magnetic field respond to an oscillating radio frequency. The liquid filled porosity, pore size distribution, and volume of movable fluids can be characterized from this. It is also possible to estimate permeability values empirically from NMR log data.
Dipmeter logs
Dipmeter logs measure the variation in electrical or sonic response around the circumference of the borehole. From this, formation dip and sometimes the orientation of sedimentary structures can be determined.[13] [14]
Borehole image logs
Borehole image logs give a detailed electrical or sonic map of the borehole wall.[15] This enables geological information such as formation dip, sedimentary structures, faulting, and fracturing to be imaged. The dip and azimuths of these features are measured from the image logs. The logs are especially useful for the structural characterization of heavily faulted and fractured reservoirs. They also show thin beds in reservoir intervals where most conventional logs do not have the resolution to detect them.
Formation tester logs
Wireline pressure test data in infill wells can provide valuable information on the reservoir performance. The formation tester log contains a probe, which is pushed horizontally against the formation to take a measurement of the reservoir pressure. A small fluid sample can also be taken if required. The pressure measurements are repeated at various depths throughout the reservoir, enabling a pressure-depth plot to be made.
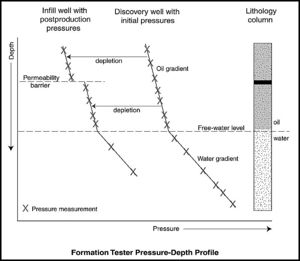
When these tests are conducted in a virgin reservoir preproduction, it may be possible to define the depth of the free-water level. This will correspond to the intersection of the water and oil (gas) gradients. Postproduction, formation tester data can give information on where the reservoir is separating into zones of different pressures as a result of depletion (Figure 5).
The raw log data will show the rate at which the pressure built up for each test, and a crude assessment of the formation permeability can be made from this.[16]
Wireline coring
Wireline methods such as sidewall coring allow the retrieval of several short plug-type cores from the borehole wall. A series of wire-attached, hollow steel bullets are fired horizontally into the borehole wall from the wireline too.[8] Sidewall cores are mainly used for lithology determination and biostratigraphic analysis.
Checkshot and vertical seismic profiles
Checkshots and vertical seismic profiles (VSPs) are used by the geophysicist to record velocity information in a well. A checkshot survey is taken at different depths down the borehole (Hardage, 1992). A log with a geophone for detecting seismic signals is run in the hole at the same time as a seismic source is activated at the surface. The distance between the source and the log is established, and the time taken for the signal to travel to the log is measured. From this, an accurate velocity can be calculated.
The major difference between a checkshot survey and a VSP is that the VSP data are recorded at a much closer sampling interval down the well. The data can be processed to produce a seismic image of the near wellbore area (Hardage, 1992). The results will be used to tie reflectors on seismic lines to geological features in the well.
LWD logs
Logging-while-drilling (LWD) logs are run as an integral part of the the drill string a short distance behind the drill bit (typically 1.5–24 m [5–80 ft]). The acronyms MWD (monitoring while drilling) or FEWD (formation evaluation while drilling) are also used. These logs enable reservoir measurements to be taken in real time, that is, while the well is being drilled (Medeiros, 1992). The log signal is sent up the borehole either by mud pulses or by electromagnetic transmission. The log response can be displayed on monitors at the rig site or transmitted back to the oil company office. Most of the capabilities of wireline logs are available in LWD form.
LWD logs may be used for several reasons:
- Real time data allow critical decisions to be made before the well has been drilled too far; for example, selection of casing points.
- The successful run of a suite of LWD logs saves a day or more tying up an expensive rig operation exclusively with wireline logging.
- They can be run as insurance logs where the need for log data is critical. This can happen in areas where there is a chance that open-hole logs may not be possible because of borehole instability (Meehan, 1994).
- They are used for steering horizontal wells (see Well types).
Production logs
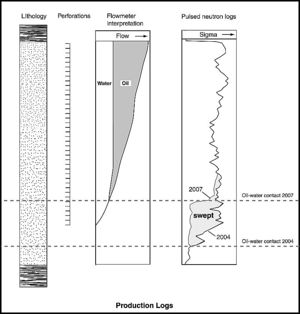
Production logs are run in a producing well to determine downhole flow rates and to evaluate reservoir sweep (Figure 6; Table 4). They give the subsurface team an understanding of how the reservoir is behaving under production. For example, if a well is producing water, the logs can then be analyzed to determine which perforated intervals are sourcing the water. The perforations can then be isolated to restore the well to dry oil production (Smolen, 1992b).
| Production log | How it works | What it is used for |
|---|---|---|
| Flowmeter log | Flow from the reservoir turns a spinner; the faster the flow, the faster the spinner turns | The flow rates and flow profile of a reservoir interval can be derived from the spin rate |
| Shut-in flowmeter log | The well is shut in; the tool measures fluid flowing from high- to low-pressured reservoir intervals via the wellbore | Can be used to pick out vertical permeability barriers |
| Pulsed neutron log | The tool bombards the pore fluid with high-energy neutrons that pass through the well casing; the neutrons are captured typically by chlorine atoms, and the gamma radiation emitted in response is measured; the log is sensitive to chlorine abundance and hence the water saturation and the salinity of the pore fluids | Fluid saturations are determined from the log results and hence the degree of sweep behind the casing can be calculated |
| Fluid density log | A variety of tools measure the fluid density by recording either the pressure gradient, the bulk density, or the capacitance of the flowing mixture in the well | Where more than one flowing phase is present, the fraction of a particular fluid flowing can be calculated, i.e., water, oil, or gas |
| Temperature log | Records a temperature profile | For example, can determine which interval is taking (cold) injection water in an injection well |
| Gamma-ray spectrometer log | Measures element concentrations, especially carbon/oxygen ratios | Indication of hydrocarbon saturations, particularly in low-salinity, clean sandstones |
The geologist uses production-log data to determine the flow geology characteristics of the reservoir and to help establish where there may be unswept oil and gas targets.
Production well-test data and interference and pulse tests
Production well tests are an important for reservoir management because they provide information on flow rates, reservoir architecture, rock properties, and reservoir pressures. A production well test is performed by inducing pressure variations in a well over time. An example of this is where a production well is shut in to conduct a pressure buildup test. Fluid will then move into the pressure sink caused by the production, and the pressure will gradually increase in the well. The pressure data are used to assess the properties of the reservoir and the reservoir fluid around the wellbore by a technique known as pressure transient analysis (Lee, 1992). For instance, the higher the permeability, the more rapidly the fluid moves in and the quicker the pressure builds up.
Two types of tests can be run to give an idea of interwell communication. Interference tests are set up by assigning one of the wells in a specific sector of the reservoir as an observation well. Then one or a number of wells is produced from or injected into and the pressure response is measured in the monitor well. Pulse tests are a variation on the theme of interference tests. The difference is that the active well is shut in, returned to production, shut in, and so on, in a series of pulses. These tests are especially useful in assessing the communication between injection and production wells (Kamal, 1983).
Radioactive or chemical tracers can be put into an injection well and nearby production wells will be monitored to see when and where the tracers are back produced (Bjornstad et al., 1990). For example, radioactive tracers have been used in the Endicott field in Alaska to identify communication pathways between injection and production wells. The data were used to assess the validity of the geological correlation for the reservoir (Shaw et al., 1996).
Fluid samples
The taking of oil and formation water fluid samples at the appraisal stage of field development can provide valuable data later on in field life. For instance, variation in oil and water geochemistry data can be used to define reservoir compartments within a field (see Areal compartments).
Production data
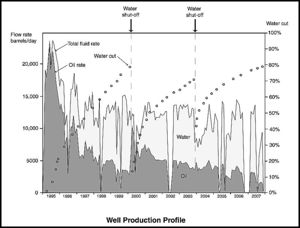
Production data can be used to make inferences about reservoir continuity and connectivity. The geologist should have direct access to the well-by-well production profiles (Figure 7). These show the rate of production against time for each well including the total fluid flow rate, hydrocarbon flow rate, water flow rate, and the water cut (percentage of water flowing relative to total flow). The idea is to look out for any unexplained changes in production or unexpected anomalies. Sometimes this happens for mechanical reasons, but, typically the anomaly may give an insight into the fluid pathways within the reservoir. For instance, a new injection well may be brought on stream, and this will cause the flow rates to increase in nearby producers. This demonstrates reservoir connectivity between the injector and the producers.
Seismic data
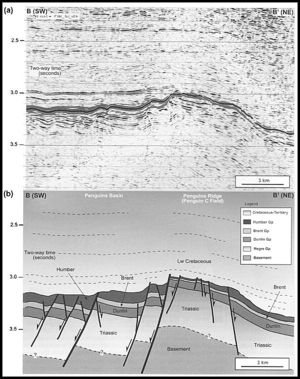
Seismic data allow subsurface structures to be identified and mapped. It provides structural information for determining suitable places to drill in an oil field. Seismic data will also help to determine the nature of the reservoir between wells, albeit at a relatively low resolution both spatially and vertically (Figure 8). Horizontally, a data point is typically acquired every 12.5 m (41 ft) with modern seismic acquisition methods offshore. Vertical resolution will mostly depend on the depth of the reservoir and to some extent on the seismic acquisition and processing parameters. The resolution decreases with increasing depth with the higher frequency component of the signal progressively getting filtered out as the sound wave passes through the subsurface. The shape of the seismic pulse will also change as a function of depth, further distorting the signal. At typical Jurassic reservoir depths in the North Sea for instance, the frequency content of the signal corresponds to a vertical resolution of about 20–40 m (66–132 ft). Features smaller than this will not be seen on seismic sections at these depths. This resolution is sufficient to make an interpretation of the reservoir structure and the position of the larger faults. The geologist will use the seismic interpretation as the basis for the structural framework in their geological scheme. An analysis of seismic data can also occasionally give an indication of the nature of reservoir porosity, fluid type, and an outline of sediment bodies.
In most companies, geophysicists are responsible for interpreting and analyzing seismic data. However, it is becoming more common for geologists in oil companies to make some of the seismic interpretation.
Seismic data are acquired in the broadest sense by sending sound waves into the subsurface and then detecting the echo. Most of the energy will be transmitted deeper into the subsurface, but part of the energy will be reflected at interfaces of different densities and velocities within the rock layers. The reflected energy returns to the surface where it is recorded by geophones, electronic receivers that convert ground motion into electronic signals. The offshore equivalent of a geophone is a hydrophone, which records the pressure pulses returning through the sea. The strength of the reflected seismic energy depends on the acoustic impedance (AI) contrast at the boundary between two layers of rock. The AI is the product of the rock density and the transmission velocity. The higher the AI contrast, the greater the strength of the reflected signal.
Seismic data can be acquired both on land and at sea. On land, a variety of sound sources have been used, including dynamite, a heavy weight repeatedly dropped on the ground, or a vibrating steel plate on the ground surface. Airguns are typically used in the marine environment.
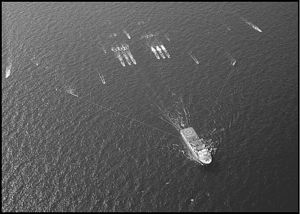
Recording devices on land consist of arrays of connected geophones laid out in long lines. At sea, hydrophones are strung together within a long plastic sheath known as a streamer. The streamer can be several kilometers long. At the end of the 20th century, a streamer was typically 3500–4000 m (11,500–13,000 ft) long. The trend today is for increasingly longer cables to allow a greater distance between the source and the furthest hydrophone on the streamer (known as the far offset, the distance between the source and the nearest hydrophone being known as the near offset). This greater distance allows for better discrimination of the variation in the recorded amplitudes for a given reflector with increasing offset, a technique known as amplitude versus offset or AVO. This can be helpful in determining whether hydrocarbons are present at a given location (Russell, 2002). Several sources and several streamers can be towed behind the seismic boat at one time (Figure 9).
Land and marine acquisition techniques differ slightly but in principle are mostly the same. The following describes the marine case. A seismic boat acquires data by sailing as carefully as it can along a predetermined line over the area of interest. When it reaches the end of this line, it turns around and acquires data along a parallel line in the opposite direction. The boat will steam back and forth line after line acquiring the seismic survey for up to months at a time depending on how large an area is to be acquired and on the weather conditions. The boat travels slowly along the predetermined line, and periodically (every 12.5 m [41 ft] or perhaps every 25 m [82 ft]) discharges the airgun. The point on the line where this occurs is known as a shotpoint. The hydrophones then record the reflection echoes from the subsurface. Simultaneously, compressors will recharge the airgun ready for the next discharge, and the process repeats over and over again. The result is a record of a large number of shot and receiver pairs for each reflection point in the subsurface. The data are recorded digitally and will include the time it takes for the seismic pulse to return to the surface, the waveform of the seismic signal, and the sound and source location. The time that the seismic energy takes to travel from the source to the reflection and back to the surface again is called the two-way traveltime (TWT). This can take 2–3 s or more. Because of the rapid velocity of seismic waves through the subsurface, seismic intervals are measured in milliseconds; 1000 ms equals 1 s.
The seismic data are interpreted with the principal objective of mapping out the structure of the reservoir. If the top of the reservoir gives a usable seismic reflection, a seismic time surface is mapped out. The map will be contoured in two-way time. It can be depth converted using velocity information to create a depth map in meters or feet.
3-D seismic surveys
The most common method of acquiring seismic data involves shooting a 3-D survey. This is where a dense coverage of seismic data has been collected over an area with the objective of determining spatial relations in three dimensions. The data are collected such that it can be processed to get as close to the correct spatial representation of the subsurface as can be practically achieved. This involves migrating the seismic data to correct for oblique reflections from dipping surfaces and faults. After processing, a 3-D data set will consist of a dense box-shaped grid of seismic data covering the field area. The grid comprises a series of inlines and crossline traces at regular intervals, every 12.5 m (41 ft) for instance.
The data are stored on a computer. The interpreter can call up the data set on the screen. It is possible to display any vertical or horizontal slice through the data as required. Vertical slices are typically used for picking horizons and faults. Two types of horizontal slices can be derived from a 3-D seismic data set. A time slice is a horizontal slice through a volume of 3-D data, which can show areal amplitude variation. Under favorable conditions, this can reveal geometrical patterns related to the depositional environment. A horizon slice is a reflection that has been flattened and then redisplayed as a time slice. It shows areal amplitude variation along the reflection.
See also
References
- ↑ Gerhardt, J. H., and H. H. Haldorsen, 1989, On the value of information: Presented at Offshore Europe, Society of Petroleum Engineers, September 5–8, Aberdeen, United Kingdom, SPE Paper 19291, 11 p.
- ↑ Whittaker, A., 1992, Mudlogging: The mudlog, in D. Morton-Thompson and A. M. Woods, eds., Development geology reference manual: AAPG Methods in Exploration Series 10, p. 101–103.
- ↑ Kunka, J. M., G. Williams, B. Cullen, J. Boyd-Gorst, G. R. Dyer, J. A. Garnham, A. Warnock, A. Davis, and P. Lynes, 2003, The Nelson field, Blocks 22/11, 22/6a, 22/7, 22/12a, UK North Sea, in J. G. Gluyas and M. H. Hichens, eds., United Kingdom oil and gas fields, commemorative millennium volume: Geological Society (London) Memoir 20, p. 617–646.
- ↑ Bajsarowicz, C. J., 1992, Core alteration and preservation, in D. Morton-Thompson and A. M. Woods, eds., Development geology reference manual: AAPG Methods in Exploration Series 10, p. 127–130.
- ↑ Caplan, M. L., and T. F. Moslow, 1999, Depositional origin and facies variability of a Middle Triassic barrier island complex, Peejay field, northeastern British Columbia: AAPG Bulletin, v. 83, no. 1, p. 128–154.
- ↑ Blackbourn, G. A., 1990, Cores and core logging for geologists: Caithness, Whittles Publishing, 120 p.
- ↑ 7.0 7.1 Serra, O., 1984, Fundamentals of well-log interpretation: 1. The acquisition of logging data: Amsterdam, Elsevier, 423 p.
- ↑ 8.0 8.1 8.2 8.3 8.4 Rider, M. H., 1996, The geological interpretation of well logs: Caithness, Whittles Publishing, 300 p.
- ↑ Luthi, S. M., 2001, Geological well logs: Their use in reservoir modelling: Berlin, Springer-Verlag, 373 p.
- ↑ Stuart, I. A., 2002, The Armada development, UK central North Sea: The Fleming, Drake and Hawkins gas-condensate fields, in J. G. Gluyas and H. M. Hichens, eds., United Kingdom oil and gas fields, commemorative millennium volume: Geological Society (London) Memoir 20, p. 139–151.
- ↑ Hurst, A., and A. Milodowski, 1996, Thorium distribution in some North Sea sandstones: Implications for petrophysical evaluation: Petroleum Geoscience, v. 2, no. 1, p. 69–68.
- ↑ Hancock, N. J., 1992, Quick-look lithology from logs, in D. Morton-Thompson and A. M. Woods, eds., Development geology reference manual: AAPG Methods in Exploration Series 10, p. 174–179.
- ↑ Bourke, L. T., 1992, Sedimentological borehole image analysis in clastic rocks: A systematic approach to interpretation, in A. Hurst, C. M. Griffiths, and P. F. Worthington, eds., Geological application of wire-line logs II: Geological Society Special Publication 65, p. 31–42.
- ↑ Cameron, G. I. F., 1992, Analysis of dipmeter data for sedimentary orientation, in A. Hurst, C. M. Griffiths, and P. F. Worthington, eds., Geological application of wire-line logs II: Geological Society Special Publication 65, p. 141–154.
- ↑ Luthi, S. M., 1992, Borehole imaging devices in D. Morton-Thompson and A. M. Woods, eds., Development geology reference manual: AAPG Methods in Exploration Series 10, p. 163–166.
- ↑ Smolen, J. J., 1992, Wireline formation testers, in D. Morton-Thompson and A. M. Woods, eds., Development geology reference manual: AAPG Methods in Exploration Series 10, p. 154–157.
