3-D seismic data: immersive visualization
| Exploring for Oil and Gas Traps | |

| |
| Series | Treatise in Petroleum Geology |
|---|---|
| Part | Predicting the occurrence of oil and gas traps |
| Chapter | Interpreting 3-D seismic data |
| Author | Geoffrey A. Dorn |
| Link | Web page |
| Store | AAPG Store |
In 3-D desktop visualization, perspective, lighting/shading, transparency, stereopsis, and in some cases head-tracking (changing the data appropriately for changes in the interpreter's head location with respect to the screen) has been applied to both surface and volume displays. With each additional visual cue used in presenting the data in 3-D, there have been improvements in efficiency. New insights have been gained about the data, and communication has improved. The next step in visualization is to engage peripheral vision—to become immersed in the data.
Facilities for immersive visualization
In 1997 ARCO, Texaco, and Norsk Hydro each installed large immersive visualization environments. The Texaco facilities are visionariums, large screens (8–10 ft tall) that curve horizontally through approximately 160° and can curve vertically. Data are projected on the screens using three projectors, each covering one-third of the screen. The sense of immersion is achieved primarily by engaging peripheral vision, filling most of the field of view with data.
Engaging peripheral vision

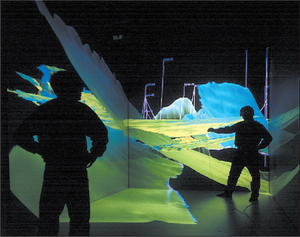
ARCO and Norsk Hydro have installed immersive visualization rooms, based on the CAVE™ invented at the University of Illinois, which consist of four projection surfaces—three orthogonal flat vertical walls and the floor. The images on the walls are rear projected, while the image on the floor is projected from the top down. The sense of immersion is achieved by engaging peripheral vision and by stereo projection of the data. In these environments, the data surround the interpreter, actually appearing to fill the room.
Figure 1 shows interpretive work performed in the Immersive Visualization Environment at ARCO. The interpreter can walk through the data, along interpreted horizons, and between faults to locations where the wells penetrate the target horizons. Since head tracking is used to properly alter the data projections for changes in head position, the view of the data changes very intuitively as the interpreter moves through the data.
Immersive rooms vs. visionariums
Both the immersive rooms and the visionariums have their application. The immersive room may be a better environment in which to actually interpret the data and plan the development, with a group of up to five people working together at one time. The visionarium may be a better arrangement for reviewing the prospect, drilling plan, or development plan for a larger management group.
Calculating depth conversion velocity
The application of these facilities and other immersive visualization devices is just beginning to be explored in the oil industry. In the not-too-distant future, these environments may fundamentally change the manner in which we do our business. One thing is certain: 3-D seismic interpretation 5–10 years from now will be very different from 3-D seismic interpretation today.
See also
References
- ↑ Dorn, G. A., 1998 Modern 3-D seismic interpretation: The Leading Edge, vol. 17, no. 9, p. 1262–1272.