File:Figure2AustinChalk2019-20CommRept.jpg
Jump to navigation
Jump to search
No higher resolution available.
Figure2AustinChalk2019-20CommRept.jpg (468 × 202 pixels, file size: 56 KB, MIME type: image/jpeg)
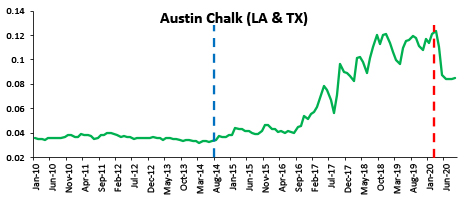
Austin Chalk production (combining Texas and Louisiana) from January 2010 through September 2020 in millions of barrels per day. Blue line shows the onset of increased production from the Austin due to the application of modern drilling methods and the red line indicates the onset of pandemic-related production declines in the U.S. (Source: U.S. EIA, 2020).
File history
Click on a date/time to view the file as it appeared at that time.
| Date/Time | Thumbnail | Dimensions | User | Comment | |
|---|---|---|---|---|---|
| current | 21:13, 5 April 2021 | | 468 × 202 (56 KB) | Molyneux (talk | contribs) | Austin Chalk production (combining Texas and Louisiana) from January 2010 through September 2020 in millions of barrels per day. Blue line shows the onset of increased production from the Austin due to the application of modern drilling methods and the... |
You cannot overwrite this file.
File usage
The following page uses this file: