File:Fluid-contacts fig4.png

Original file (1,924 × 933 pixels, file size: 108 KB, MIME type: image/png)
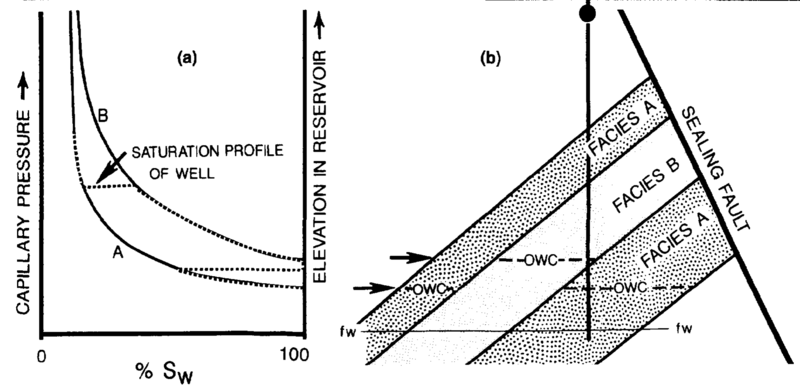
Effect of reservoir heterogeneity on fluid contacts. (a) Capillary pressure curves for facies A and B within the reservoir. The dashed line corresponds to the saturation trend of the well In part (b). Sharp changes in saturation correspond to elevations of facies changes. (b) Oil-water contact corresponding to capillary pressure curves. The free water surface (<italic>f</italic>w) is the same for all facies, but the different displacement pressure results in different oil-water contact elevations (thick arrows). The transition zones will also have different thicknesses due to different relative permeability characteristics not shown here. The vertical line is the well position corresponding to the saturation profile shown in part (a).
File history
Click on a date/time to view the file as it appeared at that time.
| Date/Time | Thumbnail | Dimensions | User | Comment | |
|---|---|---|---|---|---|
| current | 01:52, 14 January 2014 | | 1,924 × 933 (108 KB) | Importer (talk | contribs) | Effect of reservoir heterogeneity on fluid contacts. (a) Capillary pressure curves for facies A and B within the reservoir. The dashed line corresponds to the saturation trend of the well In part (b). Sharp changes in saturation correspond to elevation... |
You cannot overwrite this file.
File usage
The following page uses this file: