File:Full-waveform-acoustic-logging fig3.png
Jump to navigation
Jump to search

Size of this preview: 437 × 599 pixels. Other resolutions: 175 × 240 pixels | 948 × 1,299 pixels.
Original file (948 × 1,299 pixels, file size: 12 KB, MIME type: image/png)
Copyright of AAPG; Licensed CC-BY-SA
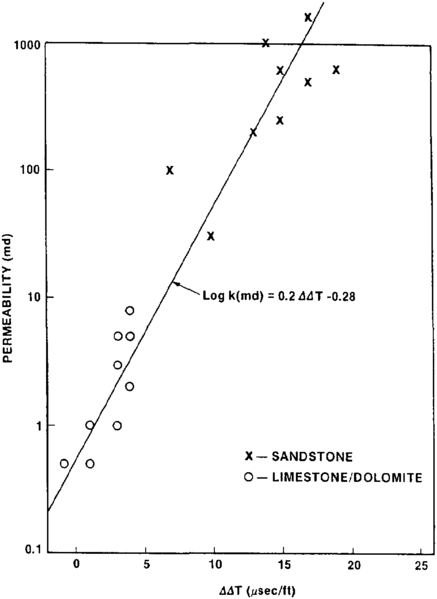
Plot of the difference between the measured slowness and the predicted elastic slowness (ΔΔT) against the core-measured permeability values for both the limestone-dolomite and the sand-shale examples. (After Burns et al., 1988.)
File history
Click on a date/time to view the file as it appeared at that time.
| Date/Time | Thumbnail | Dimensions | User | Comment | |
|---|---|---|---|---|---|
| current | 17:49, 13 January 2014 | | 948 × 1,299 (12 KB) | Importer (talk | contribs) | {{copyright|AAPG}} Plot of the difference between the measured slowness and the predicted elastic slowness (ΔΔT) against the core measured permeability values for both the limestone-dolomite and the sand-shale examples. (After Burns et al., 1988.) ... |
You cannot overwrite this file.
File usage
The following page uses this file: