Geologic mapping (UB)
| Wiki Write-Off Entry | |
|---|---|

| |
| Student Chapter | University of Brawijaya |
| Competition | June 2015 |
In the geological field, maps generated from data researchers had collected which then would be portrayed onto a basic map, which in general gives information about Earth’s reliefs interpretation, and then described on a flat plane, called geological map. Geological maps give informations about geological conditions on particular area which includes rocks units and its structures. From geological map, we can obtain type of rocks, thickness, lithological bearings (strike and dips), faults, folds, fractures, or many processes have had occurred in earlier times.
History of geological maps
William Smith (1769), a British engineer known as a pioneer of stratigraphy, created very useful geology maps and illustrated the distribution of rocks on a topographic map. The idea of making an original map of rock distribution was invented in 1684 by Martin Lister (1639-1712). Lister stated that the distribution of different types of British landscape could be accurately represented on topographic maps:
The Soil might either be coloured, by variety of Lines, or Etchings; but the great care must be, very exactly to note upon the Map
By which Lister concluded that the soil types mapping can also map the distribution of rocks in the subsurface.
Luigi Ferdinando Marsigli (1658-1730) created topographic maps for military use of countries he visited (Italy, France, Germany, the Balkans, and Turkey). Marsigli published a mining district map in Hungary and sketched the distribution of sulfur near his hometown, Bologna, in 1717.
Probably, the first geological map drawn by an anonymous naval cartographer in 1757 where in the Heligoland islands he added boundaries of four different types of rocks.[1][2]
Types of geological map
There are several different types of geological maps:
- Surface geological map: Contains geological information below the surface. These maps have various scales, 1:50,000 or greater.
- Outcrop map: Contains about the discovery of the location of the rock. These maps provide information about rock properties and its structure condition. This type of map are generally in large scale.
- Overview geological map: Gives information about formations which have been revealed, as well as the location of the extrapolation of formation is still covered by a layer of Holocene. These maps usually have scales of 1:100,000 or smaller.
- Structure map: The appearance of the depth lines explain certain layers under the surface. Medium to large scale.
- Schematic geological map: Contains geological data based on topography.
- Thematic geological map: Contains geological information about natural resources and potential energy in certain locations.
- Topography map: Shows the height of a region in the form of contour height measured against the average sea level.
- Isopach map: Represents lines that connect a formation or a layer with the same thickness without structural needed. This map generally has a medium to large scale.
- Photogeological map: Result of aerial photographs adapted to the actual condition on field.
- Hydrogeological map: Shows the condition of ground water in certain location and whether the formation is permeable or impermeable.[3]
How to make geological maps


The main equipment needed for geological mapping:
- Base Map: Used to show an overview of the area that will be mapped.
- Compass and clinometer: Used to measure the strike and dip from rock and geological structure.
- Stationery and field notebook: Used to record and describe the characteristics of rocks found at the observation location.
- Hammer and chisel: Used to take rock samples.
- Hand lens: Used to observe the characteristics of rock that cannot be seen with the eye directly, such as the grain size.
- Gauge: Used is used to determine the length of an outcrop or structure.
- GPS: Used to determine the outcrop location.
The steps of geological mapping activity are:
- Make outcrop observation, and make a description of it.
- Measure the position of rocks (strike and dip), geological structure elements, and other geological elements.
- Make a record observations in a field notebook
- Determine the outcrop location by using GPS.
Steps to create geological maps:
- Make Geological Maps Framework
- Set of data that is used to make a map. Contains:
- Symbols of station number (track)
- Types of rock symbol
- Plotting symbol of strike/dip
- Plotting symbol of structure element.
- Set of data that is used to make a map. Contains:
- Make a strike and dip map
- This map shows the plots of strike and dip from a region:
- Inventory a required data, such as strike and dip, and the description of rock into rock units along with its contacts as well as an indication of the geological structures (faults, folding)
- Plotting data on the map. we make a contour map based on the similarity towards the strike and dip of outcrops were obtained.
- How to reconstruct the pattern of strike of the rock layering pattern is as follows:
- Plot the data needed
- Create key strike/dip contour
- Reconstruct the geological structure, if any
- Reconstruct the pattern of strike and dip.
- This map shows the plots of strike and dip from a region:
- Make geological map
- Some things that need to be considered in making geological maps are:
- Determining the spread of the unit and formation.
- Restrict the lithology in accordance with the lithology contacts on the strike and dip map.
- Draw the location of geological structures in accordance with the boundary of the strike and dip map.
- Give lithology color in accordance with the standard color and provide explanation.
- Make the cross section from its map
- Some things that need to be considered in making geological maps are:
Cross Section

Geological maps can not be considered complete until there is at least one cross section has been created to show the geology below the surface. Cross section describes the structure of a region that is much clearer than a planimetris map.cross section can be drawn in addition to a map of the fair copy,and simplified again as an illustration in a cross section of the report.it can show geological formation boundary at depth,and can also be used to display a fault, cleavage and surface folds on the map.
Measures to make a cross section:
- Draw the line section (A-B) on face of the map.
- Fasten the map to the drawing board or table with the line section in parallel on the lower edges of the drawing board or table
- Tape part map, a few centimeters below the line section, then the line of paper to do the plot lines of the section.
- Basic line drawings on paper are parallel to the lines of the section of the map. Then pull a series of parallel lines on a contour intervals selected Above. The distance of these lines should be aligned with the vertical scale contour maps.
- Press the plastic ruler or a straight steel edge on paper until it cannot move, so that the paper remains parallel to the base line.
- By shifting the point of elevation along the edges, and drop a perpendicular down to the appropriate height on the paper section of every point where this part is cutting the contour lines on a map. Follow these points to give a profile of topography.
How To Read Geological Maps
Three main elements commonly found in a geological map are map units, contacts and faults, and strike and dip.
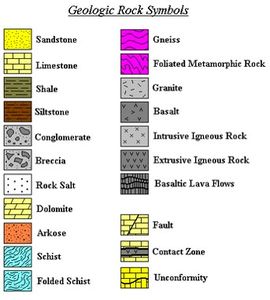
Figure 5 Lithology symbols[6]
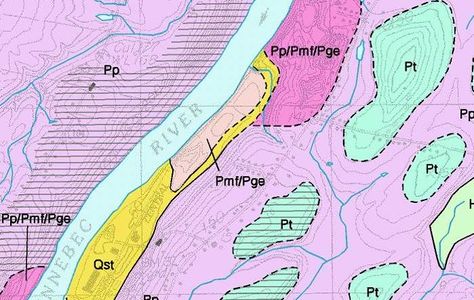
Figure 6 Contacts in geological maps[7]
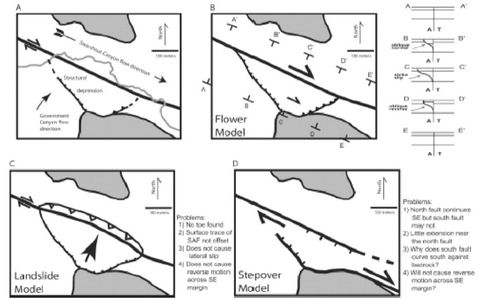
Figure 7 Faults[8]
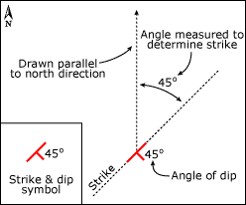
Figure 8 Strike and Dip[9]


- Map units show different rock types and other earth materials, with the specific color and symbol.
- Contacts between two maps showing where the different units of the types of rocks bordering the other rock types. A clear border is denoted by a thick line; an uncertain border by a dotted line.
- Faults are the location of a transfer plate. On a geological map, the fault line indicates where an experienced unit slid, pushed up, or dropped down relative to the binder adjacent units.
- Strike and dip symbols show the orientation of rocks to the field of fracture. Long lines show the strike, short lines show dip. Dip is usually also accompanied by a number and direction, which shows how much the angle of outcrop of rock.
References
- ↑ Franceschelli, C., and S. Marabini, 2006, Luigi Ferdinando Marsili (1658-1730): A Pioneer In Geomorphological And Archaeological Surveying, in G. B. Vai, ed., The origins of geology In Italy: Geological Society Of America Special Paper 411, p. 129-139
- ↑ Oldroyd, D., 2013, Maps as pictures or diagrams: The early development of geological maps, in V. R. Baker, ed., Rethinking the fabric of geology: Geological Society Of America Special Paper 502: p. 41-101
- ↑ Noor, Djauhari. 2009. Pengantar Geologi Dasar. Bogor: Universitas Pakuan.
- ↑ 4.0 4.1 4.2 Zakaria, Zulfiadi. 2011. Manajemen Pemetaan Geologi: Bandung: Universitas Padjadjaran
- ↑ http://serc.carleton.edu/mathyouneed/slope/topoprofile.html
- ↑ http://www.bssaonline.org/content/92/7/2704/F14.large.jpg
- ↑ http://college.cengage.com/geology/resources/protected/physicallab/thelab/geologicmaps/activities/activity1/activity1.htm
- ↑ http://www.maine.gov/dacf/mgs/pubs/mapuse/surficial/surf-read.htm
- ↑ http://www.state.nj.us/dep/seeds/rocksym.htm