Quantitative fault seal analysis
| Exploring for Oil and Gas Traps | |

| |
| Series | Treatise in Petroleum Geology |
|---|---|
| Part | Predicting the occurrence of oil and gas traps |
| Chapter | Evaluating top and fault seal |
| Author | Grant M. Skerlec |
| Link | Web page |
| Store | AAPG Store |
Modern quantitative methods of risking fault seal properties have established an empirical relationship between the observed sealing behavior of faults and the inferred sand–shale content of the fault zone.[1][2][3][4][5][6]
Importance of quantitative analysis
Quantitative fault seal analysis lets us predict fault seal behavior. Fault seal behavior is rarely random. Once we understand the pattern of seal behavior in existing fields, we can risk seal behavior in untested prospects.
Method
The capacity of a fault to leak or seal hydrocarbons is largely controlled by the smear–gouge ratio (SGR). The SGR is an estimate of the composition of that portion of the fault zone through which leakage or seal must occur. We calculate the SGR by measuring the cumulative shale and sand that has moved past that zone. A fault cross-leaks or dip-leaks if the sand–shale ratio is high in the zone (high SGR). A fault cross-seals or dip-seals if the sand–shale ratio is low in the zone (low SGR).
Several other algorithms for estimating gouge composition exist.[1][2][3][7][6] All have established a relationship between the actual seal behavior and inferred gouge composition.
Procedure
The following list outlines the procedure for quantitative fault seal analysis.
- Analyze logs to block out sands and shales.
- Calculate the SGR.
- Determine the SGR threshold for seal/leak.
Step 1: Analyze logs
The first step in quantitative fault seal analysis is determining the detailed sand–shale content of the stratigraphy. A standardized method of sand–shale discrimination is an absolute necessity. Digital logs and log analysis software simplify the process. Routine methods of sand–shale discrimination are a basic part of analysis and most log analysis software.[8]
Step 2: Calculate the SGR

Figure 1 Example of an SGR calculation for a portion of a fault at progressive throws of 50, 100, and 200 ft. Sands are patterned; shales are black. The black trace is an SP log.

Figure 2 A plot of SGR vs. throw, taken from the preceding example.
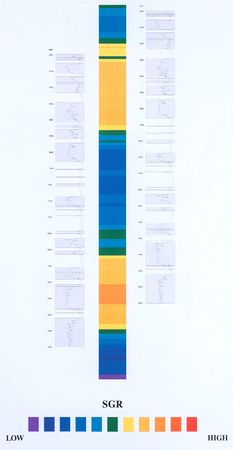
Figure 3 Variation in SGR for each point along the fault.


Figure 1 is an example of an SGR calculation for a portion of a fault at progressive throws of 50, 100, and 200 ft. Sands are patterned; shales are black. The black trace is an SP log.
The portion of the fault analyzed is adjacent to the Rd sand in the hanging wall. The SGR is the ratio of the total sand divided by the total shale that has moved past the fault. The stratigraphy that has moved past this portion of the fault is marked in red. As the throw increases, more of the stratigraphy below the Ru and Rd sands moves past the fault and the SGR changes.
A plot of SGR vs. throw, taken from the preceding example, is shown in Figure 2. At small throws, very little shale has moved past the fault, the R sand is not completely offset, and the SGR is high. As the throw increases, progressively more shale is moved past the fault and the SGR decreases. At larger throws, a thick sand package begins to move past the fault and the SGR increases.
An SGR–throw plot shows the variation in SGR with increasing displacement for only one small area along the fault plane. In practice, SGR is calculated and mapped over the surface of the entire fault plane. Figure 3 shows the variation in SGR for each point along the fault.
Determine SGR threshold

The SGR threshold for a basin is defined by determining the SGR for known sealing and leaking faults in producing fields. The empirical threshold can then be used to assess prospects and plays and well as develop fields. SGR thresholds vary among basins.
The example in Figure 4 of an SGR threshold plot for the U.S. Gulf Coast directly assigns fault seal risk based upon the variation in SGR and seal behavior observed in a data set of approximately 160 faults. The plot shows the percent of faults cross sealing for oil as a function of changing SGR. The actual SGR values have been deleted intentionally.
Above a specific SGR value, 100% of all faults in the Gulf Coast cross-leak oil. Below a specific SGR value, 100% of the faults cross-seal oil. A narrow transition zone defines the threshold for seal/leak. Separate thresholds exist for cross-seal/-leak, dip-seal/-leak, oil, and gas.
See also
References
- ↑ 1.0 1.1 Bouvier, J., D., Kaars-Sijpesteigen, C., H., Kluesner, D., F., Onyejekwe, C., C., Vander Pal, R., C., 1989, Three-dimensional seismic interpretation and fault sealing investigations, Nun River field, Nigeria: AAPG Bulletin, vol. 73, no. 11, p. 1397–1414. Cite error: Invalid
<ref>tag; name "ch10r7" defined multiple times with different content - ↑ 2.0 2.1 Allard, D., M., 1993, Fault leak controlled trap fill, rift basin examples (abs.), in Ebanks, J., Kaldi, J., Vavra, C., eds., Seals and Traps: A Multidisciplinary Approach: AAPG Hedberg conference, Crested Butte, Colorado, June 21–23.
- ↑ 3.0 3.1 Jev, B., I., Kaars-Sijpesteign, C., H., Peters, M., P., A., M., Watts, N., W., Wilkie, J., T., 1993, Akaso field, Nigeria: use of integrated 3-D seismic, fault-slicing, clay smearing and RFT pressure data on fault trapping and dynamic leakage: AAPG Bulletin, vol. 77, no. 8, p. 1389–1404. Cite error: Invalid
<ref>tag; name "ch10r40" defined multiple times with different content - ↑ Skerlec, G., M., 1997a, Atlas of fault seal behavior in the North Sea/Norwegian Sea: Franklin, Pennsylvania, SEALS International, 3948 p.
- ↑ Skerlec, G., M., 1997b, Atlas of fault seal behavior in the Gulf Coast: Franklin, Pennsylvania, SEALS International, 4356 p.
- ↑ 6.0 6.1 Yielding, G., Freeman, B., Needham, D., T., 1997, Quantitative fault seal prediction: AAPG Bulletin, vol. 81, no. 6, p. 897–917. Cite error: Invalid
<ref>tag; name "ch10r97" defined multiple times with different content - ↑ Gibson, R., G., 1994, Fault-zone seals in siliciclastic strata of the Columbus basin, offshore Trinidad: AAPG Bulletin, vol. 78, no. 9, p. 1372–1385.
- ↑ Doveton, J., H., 1986, Log analysis of subsurface geology: New York, John Wiley & Sons, 273 p.
External links
| find literature about Quantitative fault seal analysis |