Uploads by Molyneux
Jump to navigation
Jump to search
This special page shows all uploaded files.
| Date | Name | Thumbnail | Size | Description | Versions |
|---|---|---|---|---|---|
| 19:20, 10 February 2022 | AlnasserBadqaishFigure7.jpg (file) |  |
31 KB | 1 | |
| 19:20, 10 February 2022 | AlnasserBadqaishFigure6.jpg (file) |  |
309 KB | 1 | |
| 19:19, 10 February 2022 | AlnasserBadqaishFigure5.jpg (file) |  |
33 KB | 1 | |
| 19:19, 10 February 2022 | AlnasserBadqaishFigure4.jpg (file) |  |
85 KB | 1 | |
| 19:19, 10 February 2022 | AlnasserBadqaishFigure3.jpg (file) |  |
28 KB | 1 | |
| 19:17, 10 February 2022 | AlnasserBadqaishFigure2.jpg (file) |  |
46 KB | 1 | |
| 19:17, 10 February 2022 | AlnasserBadqaishFigure1.jpg (file) |  |
42 KB | 1 | |
| 18:37, 10 February 2022 | AlghufailyetalFigure5.jpg (file) |  |
106 KB | 1 | |
| 18:37, 10 February 2022 | AlghufailyetalFigure4.jpg (file) |  |
731 KB | 1 | |
| 18:36, 10 February 2022 | AlghufailyetalFigure3.jpg (file) |  |
164 KB | 1 | |
| 18:36, 10 February 2022 | AlghufailyetalFigure2.jpg (file) |  |
145 KB | 1 | |
| 18:36, 10 February 2022 | AlghufailyetalFigure1.jpg (file) |  |
52 KB | 1 | |
| 17:59, 10 February 2022 | UreigaAlmandiFigure12.jpg (file) |  |
115 KB | 1 | |
| 17:59, 10 February 2022 | UreigaAlmandiFigure11.jpg (file) |  |
121 KB | 1 | |
| 17:59, 10 February 2022 | UreigaAlmandiFigure10.jpg (file) |  |
156 KB | 1 | |
| 17:58, 10 February 2022 | UreigaAlmandiFigure9.jpg (file) |  |
107 KB | 1 | |
| 17:57, 10 February 2022 | UreigaAlmandiFigure8.jpg (file) |  |
69 KB | 1 | |
| 17:56, 10 February 2022 | UreigaAlmandiFigure7.jpg (file) |  |
42 KB | 1 | |
| 17:55, 10 February 2022 | UreigaAlmandiFigure6.jpg (file) |  |
110 KB | 1 | |
| 17:55, 10 February 2022 | UreigaAlmandiFigure5.jpg (file) |  |
46 KB | 1 | |
| 17:54, 10 February 2022 | UreigaAlmandiFigure4.jpg (file) |  |
41 KB | 1 | |
| 17:54, 10 February 2022 | UreigaAlmandiFigure3.jpg (file) |  |
53 KB | 1 | |
| 17:53, 10 February 2022 | UreigaAlmandiFigure2.jpg (file) |  |
44 KB | 1 | |
| 17:53, 10 February 2022 | UreigaAlmandiFigure1.jpg (file) |  |
510 KB | 1 | |
| 22:14, 3 February 2022 | AlsaudKatterbauerFigure6.jpg (file) |  |
77 KB | Unit 3,4, and 5 time-lapse cross-sectional EM resistivity image of the observers and injector (Baseline) before water injection (Time lapse survey) After six months of water injection | 1 |
| 22:14, 3 February 2022 | AlsaudKatterbauerFigure5.jpg (file) |  |
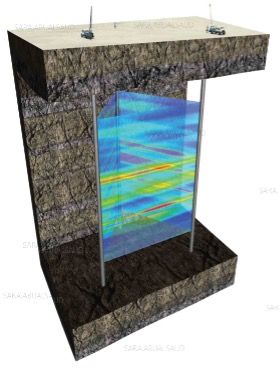
79 KB | – Time lapse EM resistivity image between OBS1 and OBS2. (A) before water injection (B) After four months of water injection | 1 |
| 22:13, 3 February 2022 | AlsaudKatterbauerFigure4.jpg (file) |  |
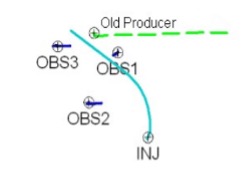
7 KB | Wells location: five spot patterns (3 observers, 1 injector, 1 producer) | 1 |
| 22:12, 3 February 2022 | AlsaudKatterbauerFigure3.jpg (file) |  |
77 KB | Cross-well EM System simple design | 1 |
| 22:12, 3 February 2022 | AlsaudKatterbauerFigure2.jpg (file) |  |
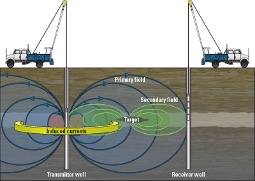
16 KB | Cross-well EM current direction between the wells and to the targeted zone. | 1 |
| 22:11, 3 February 2022 | AlsaudKatterbauerFigure1.jpg (file) |  |
30 KB | Cross-well EM Image between three wells. | 1 |
| 21:25, 3 February 2022 | AlotaibiFigure9.jpg (file) |  |
32 KB | Thin-layer chromatography (TLC). Image Source: MZ-Analysentechnik GmbH | 1 |
| 21:25, 3 February 2022 | AlotaibiFigure8.jpg (file) |  |
55 KB | High-performance liquid chromatography (HPLC). Image Source: Toppr | 1 |
| 21:24, 3 February 2022 | AlotaibiFigure7.jpg (file) |  |
76 KB | Column chromatography. Image Source: PrepGenie | 1 |
| 21:24, 3 February 2022 | AlotaibiFigure6.jpg (file) |  |
79 KB | Anion exchange chromatography. Image Source: https://sites.google.com/site/chromospectrum/i-exchange | 1 |
| 21:24, 3 February 2022 | AlotaibiFigure5.jpg (file) |  |
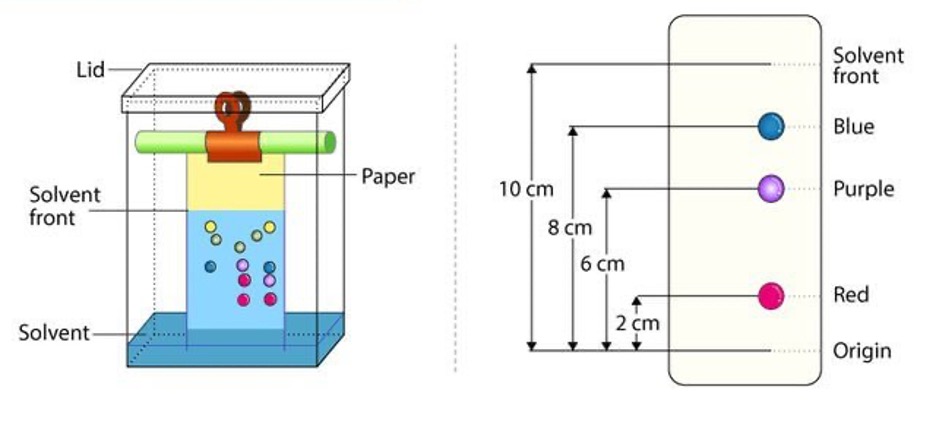
52 KB | Paper chromatography. Image Source: Ebere, E.C., Obinna, I.B., and Wirnkor, V.A.(November 2019). Applications of Column, Paper, Thin Layer and Ion Exchange Chromatography in Purifying Samples. | 1 |
| 21:23, 3 February 2022 | AlotaibiFigure4.jpg (file) |  |
39 KB | Liquid chromatography system. Image Source: César Aquiles Lázaro de la Torre1, Juan Espinoza Blanco, Joab Trajano Silva, Vânia Margaret Flosi Paschoalin, Carlos Adam Conte Júnior. (March 2014) Chromatographic detection of nitrofurans in foods of an... | 1 |
| 21:23, 3 February 2022 | AlotaibiFigure3.jpg (file) |  |
48 KB | A typical GC/MS system. Image source: Abdul-Hamid M. Emwas, Zeyad A. Al-Talla, Yang Yang, and Najeh M. Kharbatia. (March 2012). Gas Chromatography–Mass Spectrometry of Biofluids and Extracts. | 1 |
| 21:15, 3 February 2022 | AlotaibiFigure2.jpg (file) |  |
53 KB | Gas chromatography system. Image Source: Bitesize Bio. | 1 |
| 21:15, 3 February 2022 | AlotaibiFigure1.jpg (file) |  |
22 KB | Mobile and Stationary phases in chromatography. | 1 |
| 19:17, 31 January 2022 | AlfraihAlSaifFigure9.jpg (file) |  |
105 KB | This is a burial history diagram interpreted from fluid inclusions studies. Thermal maturity can also be estimated. | 1 |
| 19:16, 31 January 2022 | AlfraihAlSaifFigure8.jpg (file) |  |
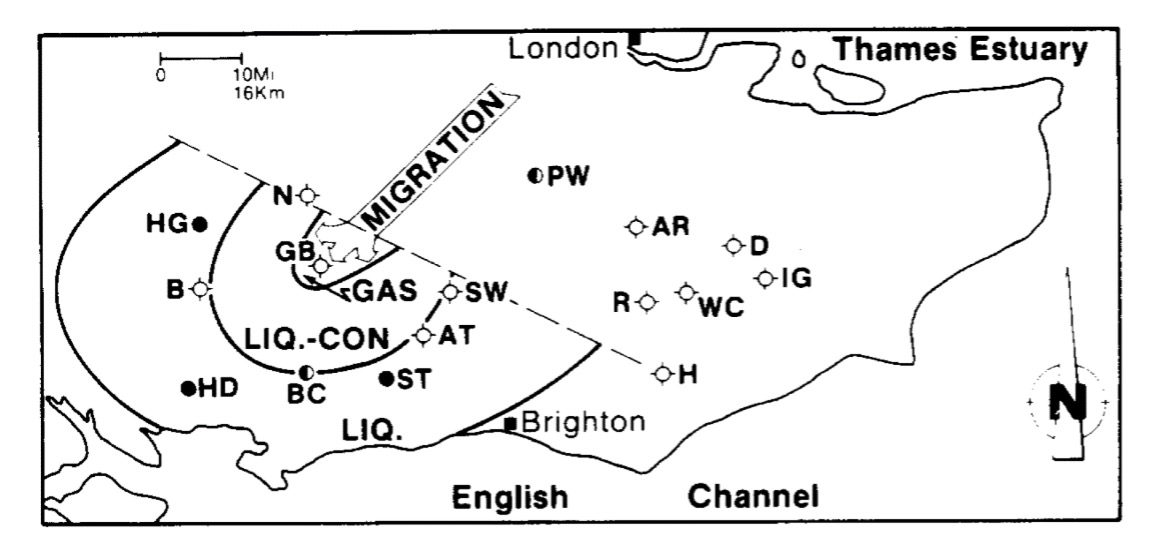
98 KB | This map illustrates migration pathways and fluid types in Wealden Basin using fluid inclusions studies. | 1 |
| 19:15, 31 January 2022 | AlfraihAlSaifFigure7.jpg (file) |  |
487 KB | A spider diagram illustrating source parameters. A) Aliphatic hydrocarbons, b) aromatic hydrocarbons from oil inclusions and crude oil. | 1 |
| 19:14, 31 January 2022 | AlfraihAlSaifFigure6.jpg (file) |  |
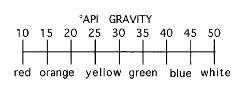
7 KB | Illustration of comparison between API gravity of petroleum fluorescence emission color when excitation is by narrow-band (365 mm peak) ultraviolet light. The color of fluorescence may be controlled by multiple variables, so this should be used as a gr... | 1 |
| 19:13, 31 January 2022 | AlfraihAlSaifFigure5.jpg (file) | 11 KB | Schematic representation of expected behavior of fluid inclusions during cycling to determine homogenization temperature. Symbols above indicate when the inclusionist should be straining to see the bubble. Numbers are hypothetical temperatures in °C. ... | 1 | |
| 19:12, 31 January 2022 | AlfraihAlSaifFigure4.jpg (file) |  |
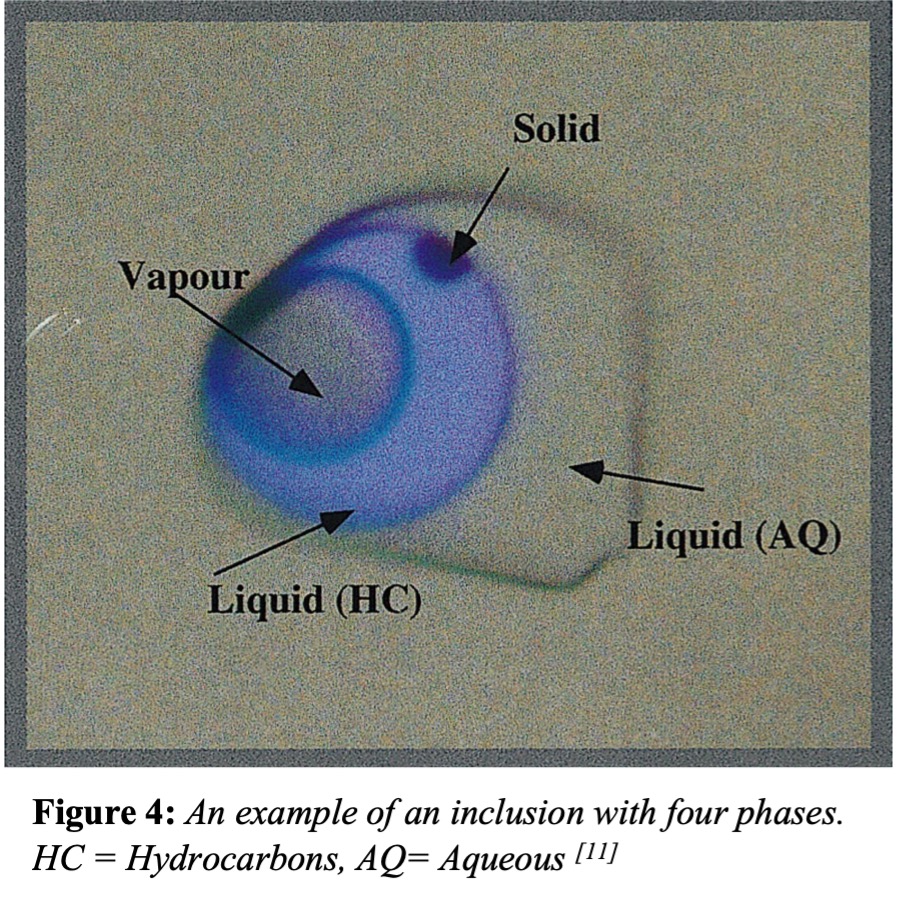
333 KB | An example of an inclusion with four phases. HC = Hydrocarbons, AQ= Aqueous. | 1 |
| 19:11, 31 January 2022 | AlfraihAlSaifFigure3.jpg (file) |  |
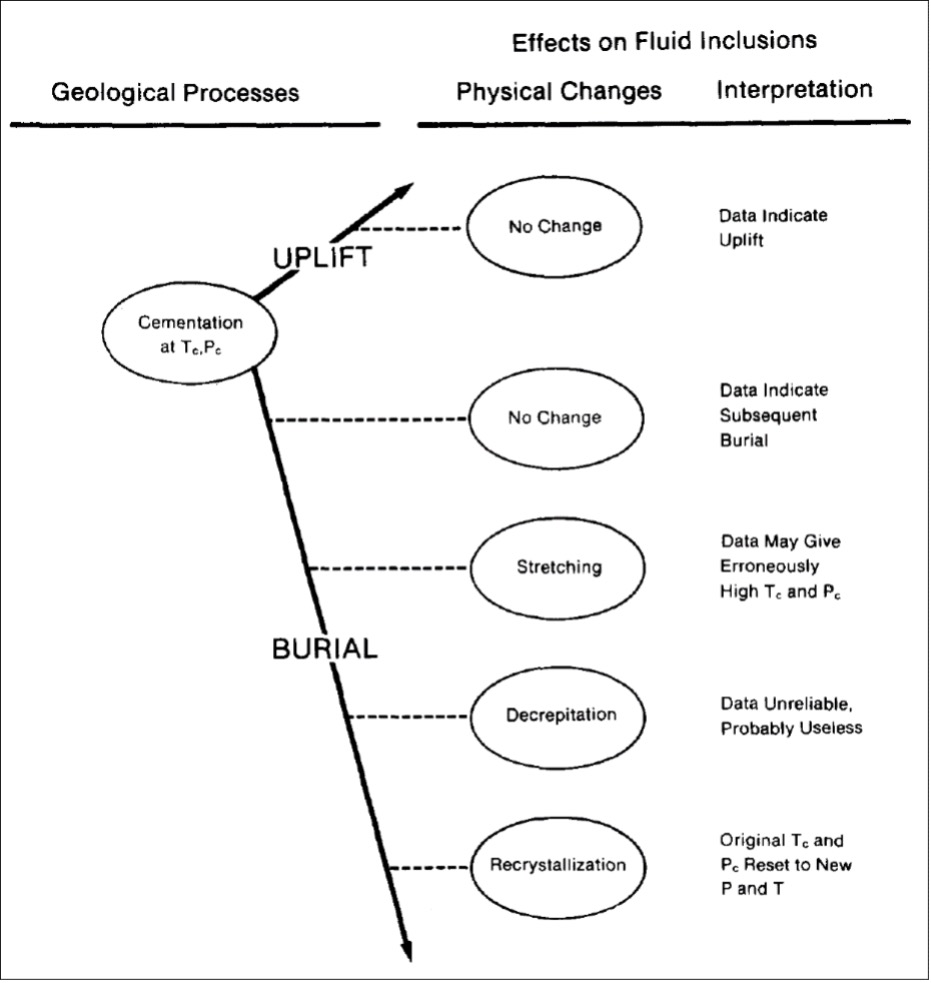
94 KB | Geological processes and their physical effects on fluid inclusion interpretations. | 1 |
| 19:10, 31 January 2022 | AlfraihAlSaifFigure2.jpg (file) |  |
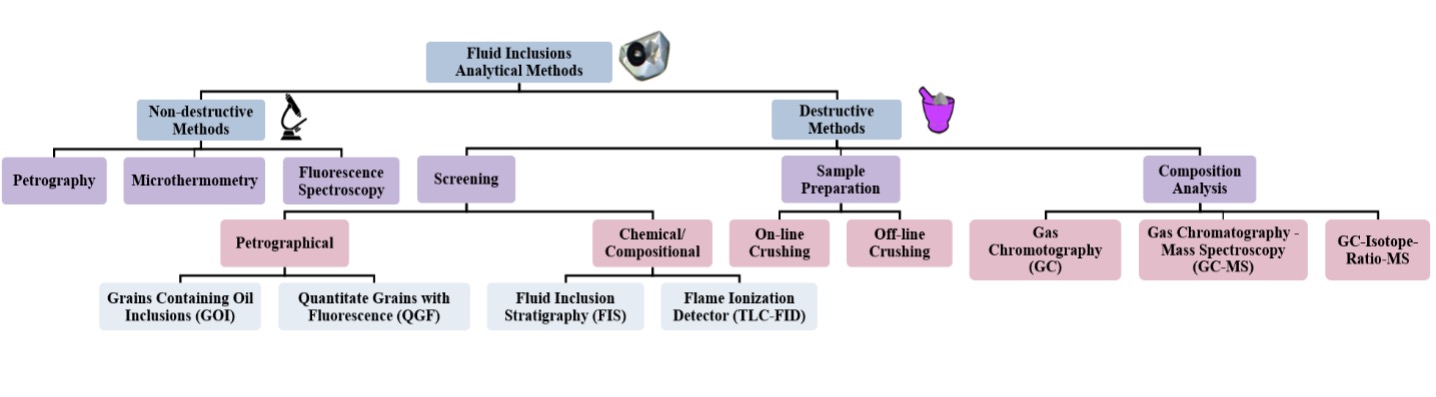
70 KB | Summary of the fluid inclusion analytical methods classified based on destructive and nondestructive methods. | 1 |
| 19:10, 31 January 2022 | AlfraihAlSaifFigure1.jpg (file) |  |
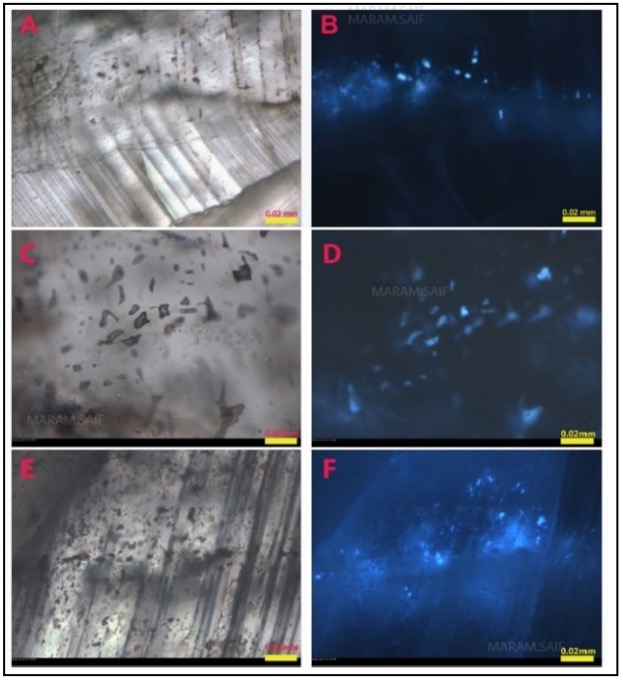
82 KB | Photomicrographs of oil-bearing fluid inclusions in Mississippian rocks examined under transmitted plane light (left) and blue fluorescence under ultraviolet light (right). | 1 |
| 23:23, 9 November 2021 | AlAhmadiTawfiqFigure10.jpg (file) |  |
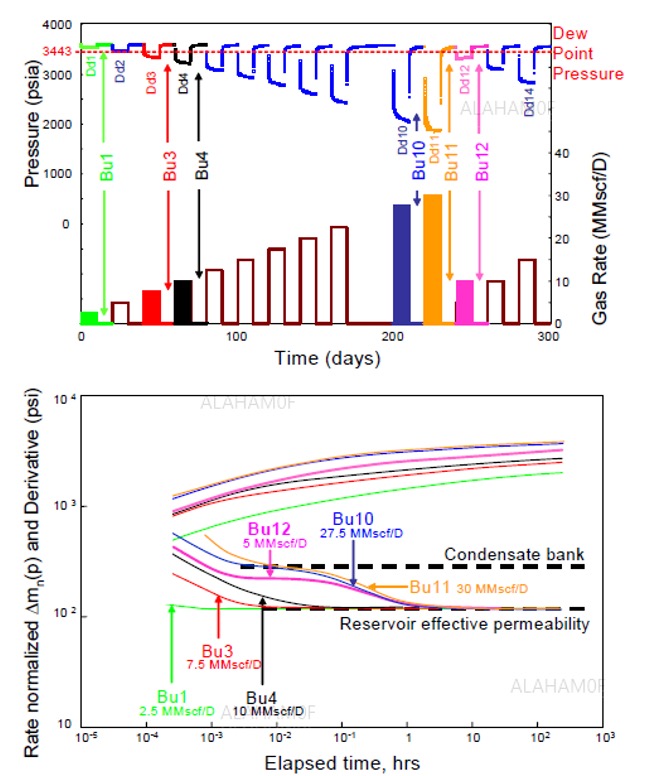
114 KB | Lean gas condensate well test behavior with increasing and decreasing flow rates (Gringarten, Bozorgzadeh, Hashemi, & Daungkaew, 2006). | 1 |
| 23:21, 9 November 2021 | AlAhmadiTawfiqFigure9.jpg (file) |  |
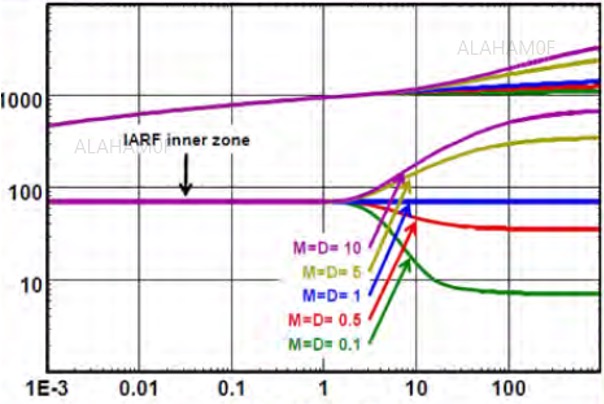
55 KB | Log-log plot of a well in two regions with varying mobility ratios (Houze, Viturat, & Fjaere, 2018) . | 1 |