Difference between revisions of "Top seal integrity: Central Graben example"
FWhitehurst (talk | contribs) |
FWhitehurst (talk | contribs) |
||
| Line 28: | Line 28: | ||
==Paleoductility analysis== | ==Paleoductility analysis== | ||
| − | Paleoductility analysis demonstrates that the top seals in these structures were extremely ductile prior to 100 Ma and would not have fractured within the range of strains developed. Since 100 Ma, these same seals were sufficiently compacted so that fracturing could have occurred if the strain exceeded the ductility of the top seal. The only strain that contributes to seal risk is the strain that occurred after 100 Ma. | + | Paleoductility analysis demonstrates that the top seals in these structures were extremely [[Ductility|ductile]] prior to 100 Ma and would not have fractured within the range of strains developed. Since 100 Ma, these same seals were sufficiently compacted so that fracturing could have occurred if the strain exceeded the ductility of the top seal. The only strain that contributes to seal risk is the strain that occurred after 100 Ma. |
==Strain threshold for failure== | ==Strain threshold for failure== | ||
Revision as of 19:50, 28 July 2014
| Exploring for Oil and Gas Traps | |

| |
| Series | Treatise in Petroleum Geology |
|---|---|
| Part | Predicting the occurrence of oil and gas traps |
| Chapter | Evaluating top and fault seal |
| Author | Grant M. Skerlec |
| Link | Web page |
| Store | AAPG Store |
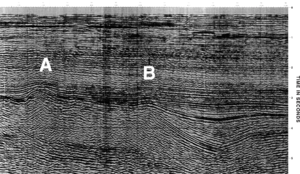
Figure 1 is an example of evaluating, or risking, top seal integrity using two traps in the Central Graben, North Sea. One trap was dry; one trap is now a producing field. Both are low-relief salt structures, a common trap style in the Central Graben, with Upper Jurassic reservoirs sealed by Upper Jurassic-Lower Cretaceous shales. A seismic line across both traps is shown in the following figure. Trap A is at the left; trap B is at the center.
Method
Incremental strain was calculated from depth-converted seismic profiles over the most highly strained portion of each structure using a series of seismic sequence boundaries that could be mapped throughout the basin. The sea floor (0 Ma sequence boundary) represents the original, undeformed line length across each structure.
Strain-time plots
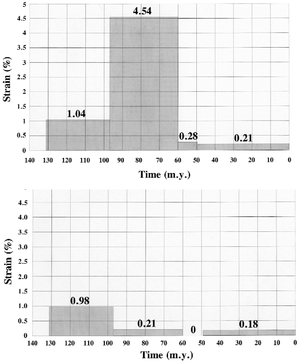
The strain-time plots in Figure 2 show the incremental strains affecting the top seal above each trap and the wide variation in strain magnitude as well as strain history in these traps. Trap A has a maximum strain of 4.5%, which contributes to the risk of top seal fracturing. The time of maximum strain occurred 97-60 Ma. Today, trap Ais a dry hole because of fracturing and loss of top seal integrity. Trap B has a maximum strain of only 1%, which occurred before 100 Ma, and only a 0.2% strain that occurred 97-60 Ma. Today, trap B is a producing structure with an intact top seal capable of trapping hydrocarbons in the underlying Upper Jurassic sands.
Paleoductility analysis
Paleoductility analysis demonstrates that the top seals in these structures were extremely ductile prior to 100 Ma and would not have fractured within the range of strains developed. Since 100 Ma, these same seals were sufficiently compacted so that fracturing could have occurred if the strain exceeded the ductility of the top seal. The only strain that contributes to seal risk is the strain that occurred after 100 Ma.
Strain threshold for failure

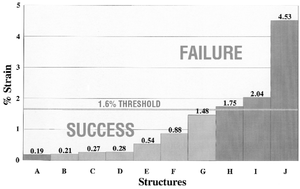
Incremental strain analysis of a group of successes and failures in the Central Graben defines a strain threshold at approximately 1.6%. In Figure 3, traps with a maximum post-100 Ma incremental strain > 1.6% are dry (traps H, I, J). Traps with a strain <1.6% are still intact and contain hydrocarbons (traps B-G). Trap A, a structure with very low strain, is dry because of natural hydraulic fracturing. Traps that were dry ue to other causes such as lack of reservoir or source are not included in this plot.
This empirical threshold provides an important tool for evaluating top seals. Prospects can be evaluated before drilling using incremental strain analysis. In this case, high-risk prospects are those with strains exceeding the threshold of 1.6%. Low-risk prospects are those with strains below the threshold.
Importance to exploration
Routine top seal analysis changes the ranking of prospects as well as the exploration strategy in the Central Graben. Large prospects, normally at the top of the ranking, unfortunately may also be large-strain, high-risk structures. The chances of success can be increased by drilling low-strain, low-risk structures. Note that prospect size and strain magnitude are not necessarily related. Large prospects could be low-relief, low-strain structures. Continued drilling in the Central Graben has confirmed this strain threshold with a larger sample of tested traps (Koch et al., 1992).
Applying strain analysis structural styles
Incremental strain analysis is not limited to analyzing low-relief salt structures like those to used in the above example. It can be applied to any structural style involving deformation of the top seal, including traps in foreland fold-and-thrust belts, Gulf Coast growth faults, and North Sea normal faults. Deformation may involve shortening or extension.
See also
- Strain analysis of top seals
- Seal ductility
- Estimating ductility of top seals
- Estimating strain in top seals

