Difference between revisions of "File:Drill-stem-testing fig6.png"
Jump to navigation
Jump to search
(Perfect chart. Gauges inside above and outside below the closing tool. Pressure transient analysis done from these gauges. (A) Run in hole, gauge measuring hydrostatic pressure of mud column; (B) initial flow period; (C) initial buildup; (D) final flow...) |
(No difference)
|
Latest revision as of 22:25, 14 January 2014
Perfect chart. Gauges inside above and outside below the closing tool. Pressure transient analysis done from these gauges. (A) Run in hole, gauge measuring hydrostatic pressure of mud column; (B) initial flow period; (C) initial buildup; (D) final flow period; (E) final buildup; and (F) release packer and pulling out of hole.
File history
Click on a date/time to view the file as it appeared at that time.
| Date/Time | Thumbnail | Dimensions | User | Comment | |
|---|---|---|---|---|---|
| current | 22:25, 14 January 2014 | 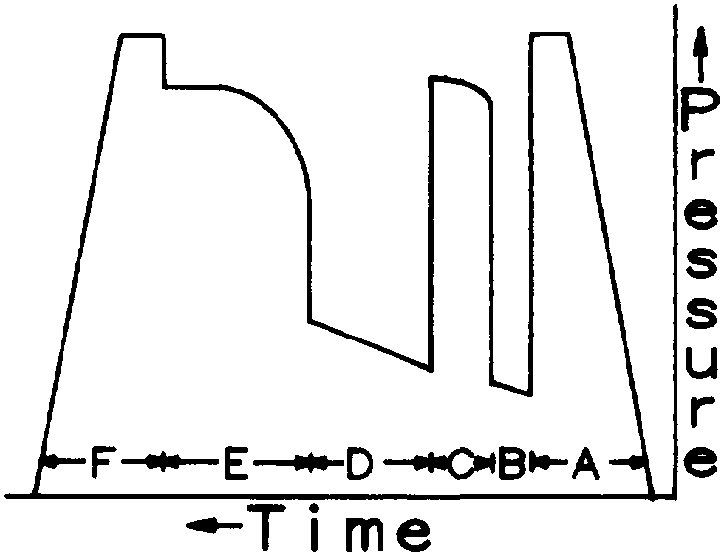 | 724 × 556 (6 KB) | Importer (talk | contribs) | Perfect chart. Gauges inside above and outside below the closing tool. Pressure transient analysis done from these gauges. (A) Run in hole, gauge measuring hydrostatic pressure of mud column; (B) initial flow period; (C) initial buildup; (D) final flow... |
You cannot overwrite this file.
File usage
The following page uses this file: