Difference between revisions of "Using conventional well logs to estimate richness"
Cwhitehurst (talk | contribs) |
Cwhitehurst (talk | contribs) |
||
| (10 intermediate revisions by 3 users not shown) | |||
| Line 1: | Line 1: | ||
| + | {{Merge|LECO method in estimating richness}} | ||
| + | |||
{{publication | {{publication | ||
| image = exploring-for-oil-and-gas-traps.png | | image = exploring-for-oil-and-gas-traps.png | ||
| Line 6: | Line 8: | ||
| part = Critical elements of the petroleum system | | part = Critical elements of the petroleum system | ||
| chapter = Evaluating source rocks | | chapter = Evaluating source rocks | ||
| − | | frompg = 6- | + | | frompg = 6-13 |
| − | | topg = 6- | + | | topg = 6-15 |
| author = Carol A. Law | | author = Carol A. Law | ||
| link = http://archives.datapages.com/data/specpubs/beaumont/ch06/ch06.htm | | link = http://archives.datapages.com/data/specpubs/beaumont/ch06/ch06.htm | ||
| Line 17: | Line 19: | ||
==Using well logs== | ==Using well logs== | ||
| − | The use of conventional well logs to predict organic richness of a unit of rock requires calibrating well log intervals to samples measured for TOC using pyrolysis or another suitable measurement technique. Using the calibrated logs, we can extrapolate TOC values to uncalibrated logs to estimate source rock richness over large areas. | + | The use of conventional well logs to predict organic richness of a unit of rock requires calibrating well log intervals to samples measured for [[Total organic carbon (TOC)|total organic carbon (TOC)]] using pyrolysis or another suitable measurement technique. Using the calibrated logs, we can extrapolate TOC values to uncalibrated logs to estimate source rock richness over large areas. |
'''Note:''' Consider changes in depositional environment and maturity when applying these techniques. | '''Note:''' Consider changes in depositional environment and maturity when applying these techniques. | ||
==Effects of organic matter on well logs== | ==Effects of organic matter on well logs== | ||
| − | The increasing concentration of organic matter in a rock directly affects its properties by lowering density slowing sonic velocity increasing radioactivity raising resistivity and raising hydrogen and carbon contents. All of these | + | The increasing concentration of organic matter in a rock directly affects its properties by lowering density slowing sonic velocity increasing radioactivity raising resistivity and raising hydrogen and carbon contents. All of these attributes can be measured using density sonic, neutron, [[Basic open hole tools#Gamma ray|gamma ray]], and [[Basic open hole tools#Resistivity|resistivity logs]]. The table below<ref name=ch06r7 /> summarizes log responses to organic matter. |
{| class = "wikitable" | {| class = "wikitable" | ||
|- | |- | ||
| − | ! Log/Property | + | ! Log/Property || Response/Value for Organic Matter (OM) || Comments |
| − | |||
| − | |||
|- | |- | ||
| − | | Gamma ray (GR) or uranium (U) | + | | Gamma ray (GR) or uranium (U) || High || High GR caused by U; can be linear with OM; U not always present |
| − | | High | ||
| − | | High GR caused by U; can be linear with OM; U not always present | ||
|- | |- | ||
| − | | Density | + | | Density || Low (approx. 1 g/cm<sup>3</sup> ) || Similar to pore fluids |
| − | | Low (approx. 1 g/cm<sup>3</sup> ) | ||
| − | | Similar to pore fluids | ||
|- | |- | ||
| − | | Neutron | + | | Neutron || High || Due to hydrogen in OM |
| − | | High | ||
| − | | Due to hydrogen in OM | ||
|- | |- | ||
| − | | Sonic | + | | Sonic || High transit time || Estimates vary from 150 to more than 200 μsec/ft |
| − | | High transit time | ||
| − | | Estimates vary from 150 to more than 200 μsec/ft | ||
|- | |- | ||
| − | | Resistivity | + | | Resistivity || High || May not affect log response unless generated hydrocarbons occupy pores |
| − | | High | ||
| − | | May not affect log response unless generated hydrocarbons occupy pores | ||
|- | |- | ||
| − | | Pulsed neutron | + | | Pulsed neutron || High carbon-oxygen ratio || Most direct measurement of carbon; needs inorganic correction |
| − | | High carbon-oxygen ratio | ||
| − | | Most direct measurement of carbon; needs inorganic correction | ||
|} | |} | ||
==Shale response example== | ==Shale response example== | ||
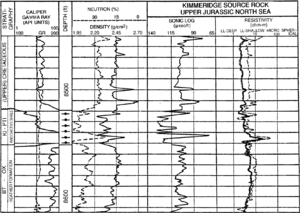
| − | [[file:evaluating-source-rocks_fig6-2.png|300px|thumb|{{figure number|1}}From Meyer and Nederlof.<ref name=Meyerandnederlof_1984>Meyer, B. L., and M. H. Nederlof, 1984, [http://archives.datapages.com/data/bulletns/1984-85/data/pg/0068/0002/0100/0121.htm Identification of source rocks on wireline logs by density/resistivity and sonic transit time/resistivity crossplots]: AAPG Bulletin, v. 68, no. 2, p. 121-129. ''Discusses the principles and application of well log analysis to identify source rocks.''</ref>]] | + | [[file:evaluating-source-rocks_fig6-2.png|300px|thumb|{{figure number|1}}Composite log of Kimmeridge shale, North Sea. From Meyer and Nederlof.<ref name=Meyerandnederlof_1984>Meyer, B. L., and M. H. Nederlof, 1984, [http://archives.datapages.com/data/bulletns/1984-85/data/pg/0068/0002/0100/0121.htm Identification of source rocks on wireline logs by density/resistivity and sonic transit time/resistivity crossplots]: AAPG Bulletin, v. 68, no. 2, p. 121-129. ''Discusses the principles and application of well log analysis to identify source rocks.''</ref>]] |
In [[:file:evaluating-source-rocks_fig6-2.png|Figure 1]], the composite log of Kimmeridge shale, North Sea is a typical log response to a high concentration of organic matter in a shale section. The underlying Heather Formation is very silty. The source rock interval is indicated by dots with dashes through them. Note the high sonic and gamma ray readings and the low density readings. The resistivity log reads only slightly higher than the overlying shale section. | In [[:file:evaluating-source-rocks_fig6-2.png|Figure 1]], the composite log of Kimmeridge shale, North Sea is a typical log response to a high concentration of organic matter in a shale section. The underlying Heather Formation is very silty. The source rock interval is indicated by dots with dashes through them. Note the high sonic and gamma ray readings and the low density readings. The resistivity log reads only slightly higher than the overlying shale section. | ||
| Line 63: | Line 51: | ||
==Limestone response example== | ==Limestone response example== | ||
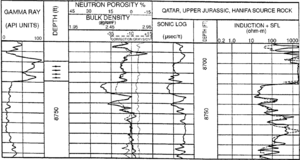
| − | [[file:evaluating-source-rocks_fig6-3.png|300px|thumb|{{figure number|2}}From Meyer and Nederlof.<ref name=Meyerandnederlof_1984 />]] | + | [[file:evaluating-source-rocks_fig6-3.png|300px|thumb|{{figure number|2}}Composite log of the Upper Jurassic Hanifa limestone in the Middle East. From Meyer and Nederlof.<ref name=Meyerandnederlof_1984 />]] |
| − | The composite log in [[:file:evaluating-source-rocks_fig6-3.png|Figure 2]] of the Upper Jurassic | + | The composite log in [[:file:evaluating-source-rocks_fig6-3.png|Figure 2]] of the Upper Jurassic Haifa [[limestone]] in the Middle East displays a typical response of organic matter in a limestone section. No shale is present in this interval. Note the high gamma ray and resistivity readings. Core analysis of this well indicates the source rock (indicated by dots with dashes through them) is mature and generating oil. |
==Limitations== | ==Limitations== | ||
| Line 85: | Line 73: | ||
[[Category:Critical elements of the petroleum system]] | [[Category:Critical elements of the petroleum system]] | ||
[[Category:Evaluating source rocks]] | [[Category:Evaluating source rocks]] | ||
| + | [[Category:Treatise Handbook 3]] | ||
Latest revision as of 15:48, 9 February 2022
| It has been suggested that this article be merged with [[::LECO method in estimating richness|LECO method in estimating richness]]. (Discuss) |
| Exploring for Oil and Gas Traps | |

| |
| Series | Treatise in Petroleum Geology |
|---|---|
| Part | Critical elements of the petroleum system |
| Chapter | Evaluating source rocks |
| Author | Carol A. Law |
| Link | Web page |
| Store | AAPG Store |
Conventional well logs are useful for estimating source rock richness both qualitatively and quantitatively. Well logs allow a qualitative identification of organic-rich formations and a quantitative analysis of the amount of organic matter. The advantages of using well logs over cuttings are continuous sampling, more accurate depth control, and greater vertical resolution.[1]
Using well logs
The use of conventional well logs to predict organic richness of a unit of rock requires calibrating well log intervals to samples measured for total organic carbon (TOC) using pyrolysis or another suitable measurement technique. Using the calibrated logs, we can extrapolate TOC values to uncalibrated logs to estimate source rock richness over large areas.
Note: Consider changes in depositional environment and maturity when applying these techniques.
Effects of organic matter on well logs
The increasing concentration of organic matter in a rock directly affects its properties by lowering density slowing sonic velocity increasing radioactivity raising resistivity and raising hydrogen and carbon contents. All of these attributes can be measured using density sonic, neutron, gamma ray, and resistivity logs. The table below[1] summarizes log responses to organic matter.
| Log/Property | Response/Value for Organic Matter (OM) | Comments |
|---|---|---|
| Gamma ray (GR) or uranium (U) | High | High GR caused by U; can be linear with OM; U not always present |
| Density | Low (approx. 1 g/cm3 ) | Similar to pore fluids |
| Neutron | High | Due to hydrogen in OM |
| Sonic | High transit time | Estimates vary from 150 to more than 200 μsec/ft |
| Resistivity | High | May not affect log response unless generated hydrocarbons occupy pores |
| Pulsed neutron | High carbon-oxygen ratio | Most direct measurement of carbon; needs inorganic correction |
Shale response example

In Figure 1, the composite log of Kimmeridge shale, North Sea is a typical log response to a high concentration of organic matter in a shale section. The underlying Heather Formation is very silty. The source rock interval is indicated by dots with dashes through them. Note the high sonic and gamma ray readings and the low density readings. The resistivity log reads only slightly higher than the overlying shale section.
Limestone response example

The composite log in Figure 2 of the Upper Jurassic Haifa limestone in the Middle East displays a typical response of organic matter in a limestone section. No shale is present in this interval. Note the high gamma ray and resistivity readings. Core analysis of this well indicates the source rock (indicated by dots with dashes through them) is mature and generating oil.
Limitations
Well-log signals are recorded for an interval thickness, which varies depending on the type of logging tool. Averaged values may not give a true picture of the richness of the source rock.
See also
References
- ↑ 1.0 1.1 Herron, S., L., 1991, In situ evaluation of potential source rocks by wireline logs, in Merrill, R., K., ed., Source and Migration Processes and Evaluation Techniques: AAPG Treatise of Petroleum Geology, Handbook of Petroleum Geology No. 1, p. 127–134.
- ↑ 2.0 2.1 Meyer, B. L., and M. H. Nederlof, 1984, Identification of source rocks on wireline logs by density/resistivity and sonic transit time/resistivity crossplots: AAPG Bulletin, v. 68, no. 2, p. 121-129. Discusses the principles and application of well log analysis to identify source rocks.