Difference between revisions of "Formation fluid pressure from repeat formation testers"
(Initial import) |
Cwhitehurst (talk | contribs) |
||
| Line 16: | Line 16: | ||
==RFT tool== | ==RFT tool== | ||
| − | + | [[file:formation-fluid-pressure-and-its-application_fig5-16.png|thumb|{{figure number|1}}Fom .<ref name=ch05r5>Dahlberg, E., C., 1994, Applied Hydrodynamics in Petroleum Exploration, 2nd ed.: New York, Springer-Verlag, 295 p. Excellent subsurface fluid pressure reference. Covers hydrodynamic and static fluids.</ref> Copyright: Springer-Verlag.]] | |
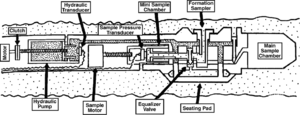
| − | [[file:formation-fluid-pressure-and-its-application_fig5-16.png| | + | The repeat formation tester (RFT) tool was designed to measure formation pressure quickly and accurately. It measures pressure at specific points on the borehole wall. The diagram below shows a typical RFT tool. Formation pressure is measured by the formation sampler (see diagram in [[:file:formation-fluid-pressure-and-its-application_fig5-16.png|Figure 1]]) when it is extended from the tool to contact the formation. Fluid samples from the formation can also be taken with the tool. |
==Differences between RFTs and DSTs== | ==Differences between RFTs and DSTs== | ||
| Line 73: | Line 73: | ||
==Example: comparing RFT to DST== | ==Example: comparing RFT to DST== | ||
| − | |||
| − | [[file:formation-fluid-pressure-and-its-application_fig5-17.png|thumb|{{figure number| | + | [[file:formation-fluid-pressure-and-its-application_fig5-17.png|thumb|{{figure number|2}}. Copyright: Gunter and Moore, 1987; courtesy JPT.]] |
| + | |||
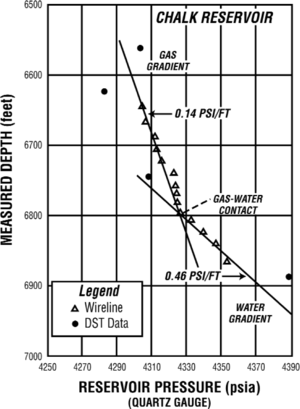
| + | [[:file:formation-fluid-pressure-and-its-application_fig5-17.png|Figure 2]] is a plot of reservoir pressure vs. depth from a low-[[permeability]] chalk reservoir. The RFT data clearly show the hydrostatic gradient, the gas gradient, and the gas-water contact. Making the same interpretation from the DST data in this example is very difficult because data are from a low-permeability chalk reservoir. Reliable pressures are difficult to obtain in low-permeability reservoirs with DSTs. Extrapolated DST shut-in pressures from a partial buildup may not reflect actual fluid pressures. As rock quality increases, extrapolated pore pressure from DST buildup falls more and more closely to actual fluid pressure. | ||
| + | |||
| + | [[file:formation-fluid-pressure-and-its-application_fig5-18.png|thumb|{{figure number|3}}See text for explanation.]] | ||
==RFT pressure profile== | ==RFT pressure profile== | ||
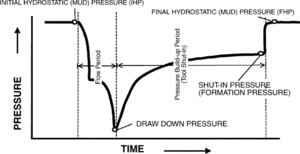
| − | + | [[:file:formation-fluid-pressure-and-its-application_fig5-18.png|Figure 3]] is a typical RFT pressure-time profile. Points are similar to points on a DST pressure profile. | |
| − | |||
| − | [[file:formation-fluid-pressure-and-its-application_fig5-18.png| | ||
==Operating an RFT survey== | ==Operating an RFT survey== | ||
Revision as of 19:35, 4 February 2014
| Exploring for Oil and Gas Traps | |

| |
| Series | Treatise in Petroleum Geology |
|---|---|
| Part | Critical elements of the petroleum system |
| Chapter | Formation fluid pressure and its application |
| Author | Edward A. Beaumont, Forrest Fiedler |
| Link | Web page |
| Store | AAPG Store |
RFT tool[edit]

The repeat formation tester (RFT) tool was designed to measure formation pressure quickly and accurately. It measures pressure at specific points on the borehole wall. The diagram below shows a typical RFT tool. Formation pressure is measured by the formation sampler (see diagram in Figure 1) when it is extended from the tool to contact the formation. Fluid samples from the formation can also be taken with the tool.
Differences between RFTs and DSTs[edit]
An RFT has several important advantages for formation pressure measurement over a DST. The table below lists some considerations.
| Consideration | RFTs | DSTs |
|---|---|---|
| Time to take one measurement | Less than 5 minutes for permeable formations | More than 90 minutes |
| Drilling delay to run test | About one logging run (wireline conveyed) | About equal to two trips with drillstring |
| Sampling interval | Small, | Several feet or more; generally tests multiple flow units |
| Samples per run | Many | Few |
| Expense per test | Small | Large |
| Purpose of tool | Pressure measurement | Fluid recovery and pressure |
| Survey problems | * Getting good seat to measure pressure * Screen plugging with material in drilling mud | * Packer failure * Depth determination |
| Fractured reservoir | May be unreliable | Good if fractures intersect wellbore |
| Layered reservoir | Not representative | Good if many layers are included in tested interval |
| Skin damage | Can be major error | Can be measured and corrected for |
Example: comparing RFT to DST[edit]
Figure 2 is a plot of reservoir pressure vs. depth from a low-permeability chalk reservoir. The RFT data clearly show the hydrostatic gradient, the gas gradient, and the gas-water contact. Making the same interpretation from the DST data in this example is very difficult because data are from a low-permeability chalk reservoir. Reliable pressures are difficult to obtain in low-permeability reservoirs with DSTs. Extrapolated DST shut-in pressures from a partial buildup may not reflect actual fluid pressures. As rock quality increases, extrapolated pore pressure from DST buildup falls more and more closely to actual fluid pressure.
RFT pressure profile[edit]
Figure 3 is a typical RFT pressure-time profile. Points are similar to points on a DST pressure profile.
Operating an RFT survey[edit]
The table below explains how to operate an RFT survey (see .[2]
| Step | Action |
|---|---|
| 1 | Use well logs to pick permeable zones for formation pressure measurements. Look for an invasion profile. |
| 2 | Plot mud hydrostatic and formation pressure at the well site to recognize anomalies or tool errors and to optimize station coverage. |
| 3 | Occasionally repeat formation pressure measurements at the same depth to check for consistency. |
| 4 | Repeat at some of the same depths for multiple surveys to help normalize the different surveys. |
| 5 | Sample both water- and hydrocarbon-bearing intervals to establish both the water and hydrocarbon pressure gradients. |
| 6 | Plot pressures at the same scale as well logs to aid in interpretation. |
Controlling RFT quality[edit]
The table below describes how to control RFT quality. For details, see .[2]
| Step | Action |
|---|---|
| 1 | Inspect the tool and check calibration before going in the hole. |
| 2 | Run quartz and strain gauges simultaneously. Record both readings independently. Normalize to one another after completing the survey. |
| 3 | Maintain a slight overflow of mud to keep the level in the borehole constant during the survey and to prevent mud hydrostatic pressure errors. |
| 4 | Take mud hydrostatic pressures while descending into the hole to give the instruments time to equilibrate to changing temperature and pressure and to provide a mud hydrostatic pressure profile. |
| 5 | Check for tool errors by calculating mud hydrostatic pressures at different depths from mud weight; check them against measured mud hydrostatic pressures at the same depths. |
See also[edit]
References[edit]
- ↑ Dahlberg, E., C., 1994, Applied Hydrodynamics in Petroleum Exploration, 2nd ed.: New York, Springer-Verlag, 295 p. Excellent subsurface fluid pressure reference. Covers hydrodynamic and static fluids.
- ↑ 2.0 2.1 Gunter, J., M., Moore, C., V., 1987, Improved use of wireline testers for reservoir evaluation: Journal of Petroleum Technology, p. 635–644. Good explanation of the use and interpretation of wireline pressure testers.

