Difference between revisions of "Quantitative biostratigraphy"
Cwhitehurst (talk | contribs) |
Cwhitehurst (talk | contribs) m (added Category:Treatise Handbook 3 using HotCat) |
||
| (9 intermediate revisions by 2 users not shown) | |||
| Line 6: | Line 6: | ||
| part = Predicting the occurrence of oil and gas traps | | part = Predicting the occurrence of oil and gas traps | ||
| chapter = Applied paleontology | | chapter = Applied paleontology | ||
| − | | frompg = 17- | + | | frompg = 17-48 |
| − | | topg = 17- | + | | topg = 17-49 |
| author = Robert L. Fleisher, H. Richard Lane | | author = Robert L. Fleisher, H. Richard Lane | ||
| link = http://archives.datapages.com/data/specpubs/beaumont/ch17/ch17.htm | | link = http://archives.datapages.com/data/specpubs/beaumont/ch17/ch17.htm | ||
| Line 18: | Line 18: | ||
==Graphic correlation== | ==Graphic correlation== | ||
| − | [[file:applied-paleontology_fig17-27.png|thumb|{{figure number|1}} | + | [[file:applied-paleontology_fig17-27.png|300px|thumb|{{figure number|1}}Graphic correlation of two sections..]] |
Graphic correlation<ref name=ch17r79>Shaw, A., B., 1964, Time in Stratigraphy: New York, McGraw-Hill, 365 p.</ref> is a widely accepted deterministic technique for ranking fossil occurrences according to the geological time represented in a set of reference sections. This approach has broad applications to solving biostratigraphic and sedimentologic problems (see Mann & Lane<ref name=ch17r61>Mann, K., O., Lane, H., R., eds., 1995, Graphic Correlation: SEPM (Society for Sedimentary Geology) Special Publication 53, 263 p.</ref>). | Graphic correlation<ref name=ch17r79>Shaw, A., B., 1964, Time in Stratigraphy: New York, McGraw-Hill, 365 p.</ref> is a widely accepted deterministic technique for ranking fossil occurrences according to the geological time represented in a set of reference sections. This approach has broad applications to solving biostratigraphic and sedimentologic problems (see Mann & Lane<ref name=ch17r61>Mann, K., O., Lane, H., R., eds., 1995, Graphic Correlation: SEPM (Society for Sedimentary Geology) Special Publication 53, 263 p.</ref>). | ||
| − | The format for a graphic correlation is an x–y crossplot on which biostratigraphic data (tops, bases, abundance/diversity events) recorded by measured stratigraphic position in one section (y-axis) may be matched to like occurrences in another section or a composite standard (x-axis; [[:file:applied-paleontology_fig17-27.png|Figure 1]]). Based on the array of data points, a preferred overall correlation can be defined by one or more line segments. Points falling on the line(s) of correlation are interpreted to be synchronous markers; those off the line(s), diachronous. | + | The format for a graphic correlation is an x–y crossplot on which biostratigraphic data (tops, bases, abundance/diversity events) recorded by measured stratigraphic position in one section (y-axis) may be matched to like occurrences in another section or a composite standard (x-axis; [[:file:applied-paleontology_fig17-27.png|Figure 1]]). Based on the array of data points, a preferred overall correlation can be defined by one or more line segments. Points falling on the line(s) of correlation are interpreted to be [http://en.wiktionary.org/wiki/isochronous synchronous] markers; those off the line(s), [http://www.thefreedictionary.com/diachronous diachronous]. |
[[:file:applied-paleontology_fig17-27.png|Figure 1]] shows a graphic correlation of two sections. | [[:file:applied-paleontology_fig17-27.png|Figure 1]] shows a graphic correlation of two sections. | ||
| − | [[file:applied-paleontology_fig17-28.png|thumb|{{figure number|2}} | + | ==Composite standards== |
| + | |||
| + | [[file:applied-paleontology_fig17-28.png|300px|thumb|{{figure number|2}}Graphic correlation interpretation of well data (tops only).]] | ||
| − | |||
An optimum sequence can be derived by graphically correlating a series of sections and establishing a composite standard—a database of the maximum time-stratigraphic ranges for a particular area under study. A composite standard should provide a relatively complete biostratigraphic representation of geologic time. On graphic correlation plots, apparent hiatuses are defined and quantified in time (composite standard units) by horizontal terraces. Fossil ranges in a composite standard are subject to alteration with each new graphic correlation, making it a complex, evolving database that usually requires computerized data management and applications. | An optimum sequence can be derived by graphically correlating a series of sections and establishing a composite standard—a database of the maximum time-stratigraphic ranges for a particular area under study. A composite standard should provide a relatively complete biostratigraphic representation of geologic time. On graphic correlation plots, apparent hiatuses are defined and quantified in time (composite standard units) by horizontal terraces. Fossil ranges in a composite standard are subject to alteration with each new graphic correlation, making it a complex, evolving database that usually requires computerized data management and applications. | ||
| − | As applied to geologic interpretation, a composite standard (1) unifies biostratigraphic data into a high-resolution time correlation framework and (2) provides a quantitative basis for defining the time significance of faults, unconformities, and other sequence stratigraphic boundaries. | + | As applied to geologic interpretation, a composite standard (1) unifies biostratigraphic data into a high-resolution time correlation framework and (2) provides a quantitative basis for defining the time significance of faults, [[Unconformity|unconformities]], and other sequence stratigraphic boundaries. |
[[:file:applied-paleontology_fig17-28.png|Figure 2]] is a graphic correlation interpretation of well data (tops only). | [[:file:applied-paleontology_fig17-28.png|Figure 2]] is a graphic correlation interpretation of well data (tops only). | ||
==Probabilistic correlations== | ==Probabilistic correlations== | ||
| − | The sequence of biostratigraphic events (i.e., highest and lowest occurrences) is frequently different, to a greater or lesser degree, between even nearby wells or outcrop sections. ''Probabilistic biostratigraphy'' is a statistical technique that determines the probability a sequence of biostratigraphic events will occur in a specific order. Probabilistic correlations, accordingly, are based on the sequence of events and not on the stratigraphic intervals or distances between them. | + | The sequence of biostratigraphic events (i.e., highest and lowest occurrences) is frequently different, to a greater or lesser degree, between even nearby wells or [http://www.merriam-webster.com/dictionary/outcrop outcrop sections]. ''Probabilistic biostratigraphy'' is a statistical technique that determines the probability a sequence of biostratigraphic events will occur in a specific order. Probabilistic correlations, accordingly, are based on the sequence of events and not on the stratigraphic intervals or distances between them. |
Probabilistic techniques can help us recognize objectively the most probable sequence of events and therefore can be used in (1) constructing interval zones and zonations and (2) evaluating the reliability of particular biostratigraphic events in local or regional settings. | Probabilistic techniques can help us recognize objectively the most probable sequence of events and therefore can be used in (1) constructing interval zones and zonations and (2) evaluating the reliability of particular biostratigraphic events in local or regional settings. | ||
| Line 58: | Line 59: | ||
[[Category:Predicting the occurrence of oil and gas traps]] | [[Category:Predicting the occurrence of oil and gas traps]] | ||
[[Category:Applied paleontology]] | [[Category:Applied paleontology]] | ||
| + | [[Category:Treatise Handbook 3]] | ||
Latest revision as of 20:58, 31 January 2022
| Exploring for Oil and Gas Traps | |

| |
| Series | Treatise in Petroleum Geology |
|---|---|
| Part | Predicting the occurrence of oil and gas traps |
| Chapter | Applied paleontology |
| Author | Robert L. Fleisher, H. Richard Lane |
| Link | Web page |
| Store | AAPG Store |
Advances in statistical methods and computer technology provide paleontologists with a variety of techniques for collecting, managing, and evaluating large volumes of biostratigraphic data. Several quantitative methods have been developed to define an optimum sequence of biostratigraphic events, compositing data from many different stratigraphic sections to serve as a reference standard that will overcome inconsistencies that may be encountered in the fossil record at particular locales.
Graphic correlation[edit]
Graphic correlation[1] is a widely accepted deterministic technique for ranking fossil occurrences according to the geological time represented in a set of reference sections. This approach has broad applications to solving biostratigraphic and sedimentologic problems (see Mann & Lane[2]).
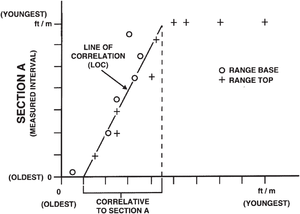
The format for a graphic correlation is an x–y crossplot on which biostratigraphic data (tops, bases, abundance/diversity events) recorded by measured stratigraphic position in one section (y-axis) may be matched to like occurrences in another section or a composite standard (x-axis; Figure 1). Based on the array of data points, a preferred overall correlation can be defined by one or more line segments. Points falling on the line(s) of correlation are interpreted to be synchronous markers; those off the line(s), diachronous.
Figure 1 shows a graphic correlation of two sections.
Composite standards[edit]
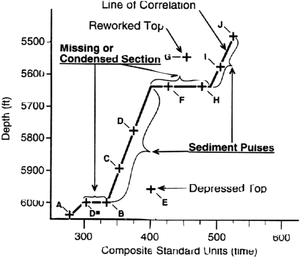
An optimum sequence can be derived by graphically correlating a series of sections and establishing a composite standard—a database of the maximum time-stratigraphic ranges for a particular area under study. A composite standard should provide a relatively complete biostratigraphic representation of geologic time. On graphic correlation plots, apparent hiatuses are defined and quantified in time (composite standard units) by horizontal terraces. Fossil ranges in a composite standard are subject to alteration with each new graphic correlation, making it a complex, evolving database that usually requires computerized data management and applications.
As applied to geologic interpretation, a composite standard (1) unifies biostratigraphic data into a high-resolution time correlation framework and (2) provides a quantitative basis for defining the time significance of faults, unconformities, and other sequence stratigraphic boundaries.
Figure 2 is a graphic correlation interpretation of well data (tops only).
Probabilistic correlations[edit]
The sequence of biostratigraphic events (i.e., highest and lowest occurrences) is frequently different, to a greater or lesser degree, between even nearby wells or outcrop sections. Probabilistic biostratigraphy is a statistical technique that determines the probability a sequence of biostratigraphic events will occur in a specific order. Probabilistic correlations, accordingly, are based on the sequence of events and not on the stratigraphic intervals or distances between them.
Probabilistic techniques can help us recognize objectively the most probable sequence of events and therefore can be used in (1) constructing interval zones and zonations and (2) evaluating the reliability of particular biostratigraphic events in local or regional settings.
Probabilistic methodology[edit]
The sequence of biostratigraphic events [i.e., highest occurrences, or last-appearance datums (LAD), and lowest occurrences, or first-appearance datums (FAD)] is determined for each section to be used in a study. The most complete is taken as a hypothetical most probable sequence and is statistically compared with all the other sequences in the study. The original hypothetical sequence is revised based on this analysis; the result is the most probable sequence of biostratigraphic events and an indication of their chronostratigraphic reliability. A high frequency of crossovers (mismatches) for a pair of species in the sections under study suggests the biostratigraphic events are closely spaced in relative time; few crossovers suggest a wider time spacing.

