Difference between revisions of "Static gas pressure gradient estimation"
Cwhitehurst (talk | contribs) |
Cwhitehurst (talk | contribs) m (added Category:Treatise Handbook 3 using HotCat) |
||
| (8 intermediate revisions by 3 users not shown) | |||
| Line 6: | Line 6: | ||
| part = Critical elements of the petroleum system | | part = Critical elements of the petroleum system | ||
| chapter = Formation fluid pressure and its application | | chapter = Formation fluid pressure and its application | ||
| − | | frompg = 5- | + | | frompg = 5-21 |
| − | | topg = 5- | + | | topg = 5-25 |
| author = Edward A. Beaumont, Forrest Fiedler | | author = Edward A. Beaumont, Forrest Fiedler | ||
| link = http://archives.datapages.com/data/specpubs/beaumont/ch05/ch05.htm | | link = http://archives.datapages.com/data/specpubs/beaumont/ch05/ch05.htm | ||
| Line 22: | Line 22: | ||
==Procedure: estimating gas pressure gradient== | ==Procedure: estimating gas pressure gradient== | ||
<gallery mode=packed heights=250px widths=250px> | <gallery mode=packed heights=250px widths=250px> | ||
| − | file:formation-fluid-pressure-and-its-application_fig5-8.png|{{figure number|1}}Pseudoreduced temperature and pressure. From Schowalter, 1979 | + | file:formation-fluid-pressure-and-its-application_fig5-8.png|{{figure number|1}}Pseudoreduced temperature and pressure. From Schowalter;<ref name=Schowalter1979>Schowalter, T.T., 1979, [http://archives.datapages.com/data/bulletns/1977-79/data/pg/0063/0005/0700/0723.htm Mechanics of secondary hydrocarbon migration and entrapment]: AAPG Bulletin, vol. 63, no. 5, p. 723–760.</ref> courtesy AAPG. |
| − | file:formation-fluid-pressure-and-its-application_fig5-9.png|{{figure number|2}}Estimate compressibility factor, ''z''. From Schowalter | + | file:formation-fluid-pressure-and-its-application_fig5-9.png|{{figure number|2}}Estimate compressibility factor, ''z''. From Schowalter;<ref name=Schowalter1979 /> courtesy AAPG. |
| − | file:formation-fluid-pressure-and-its-application_fig5-10.png|{{figure number|3}}Estimate gas density. From Schowalter | + | file:formation-fluid-pressure-and-its-application_fig5-10.png|{{figure number|3}}Estimate gas density. From Schowalter;<ref name=Schowalter1979 /> courtesy AAPG. |
| − | file:formation-fluid-pressure-and-its-application_fig5-11.png|{{figure number|4}}Average gas chart. Copyright: Gearhart-Owens, | + | file:formation-fluid-pressure-and-its-application_fig5-11.png|{{figure number|4}}Average gas chart. Copyright: Gearhart-Owens.<ref name=G-O>Gearhart-Owens Industries, 1972, GO Log Interpretation Reference Data Handbook: |
| + | Fort Worth, Gearhart-Owens Industries Inc., 226 p.</ref> | ||
</gallery> | </gallery> | ||
Follow this procedure to estimate the gas pressure gradient of a gas reservoir or potential gas reservoir. | Follow this procedure to estimate the gas pressure gradient of a gas reservoir or potential gas reservoir. | ||
| − | + | #* If data are available on gas composition and formation temperature go to step 2. | |
| − | + | #* If no data on gas composition or formation temperature are available, estimate gas density from the average gas chart ([[:file:formation-fluid-pressure-and-its-application_fig5-11.png|Figure 4]]) and go to Step 6. | |
| − | + | # Determine the apparent molecular weight of the gas mixture. | |
| − | + | # Read pseudoreduced temperature and pressure from [[:file:formation-fluid-pressure-and-its-application_fig5-8.png|Figure 1]]. | |
| − | + | # If not already known, estimate compressibility factor, ''z'' , from [[:file:formation-fluid-pressure-and-its-application_fig5-9.png|Figure 2]]. | |
| − | + | # Using information obtained from steps 2, 3, and 4, estimate gas density from [[:file:formation-fluid-pressure-and-its-application_fig5-10.png|Figure 3]]. | |
| − | + | # Estimate gas pressure gradient using the following formula: | |
| − | * If data are available on gas composition and formation temperature go to step 2. | + | ::<math>\mbox{P}_{\rm gas\ grad} = \rho_{\rm gas} \times 0.433 \mbox{ psi/ft}</math> |
| − | * If no data on gas composition or formation temperature are available, estimate gas density from the average gas chart ([[:file:formation-fluid-pressure-and-its-application_fig5-11.png|Figure 4]]) and go to Step 6. | + | ::: where: |
| − | + | :: P<sub>gas grad</sub> = gas pressure gradient | |
| − | + | :: ρ<sub>gas</sub> = gas density | |
| − | |||
| − | |||
| − | |||
| − | |||
| − | |||
| − | |||
| − | |||
| − | |||
| − | |||
| − | |||
| − | |||
| − | |||
| − | |||
| − | |||
| − | :<math>\mbox{P}_{\rm gas\ grad} = \rho_{\rm gas} \times 0.433 \mbox{ psi/ft}</math> | ||
| − | |||
| − | where: | ||
| − | |||
| − | |||
| − | |||
==Determining molecular weight== | ==Determining molecular weight== | ||
| Line 91: | Line 72: | ||
==Average natural gas== | ==Average natural gas== | ||
| − | According to Gerhardt-Owens (1970), average natural gas estimated by Stephens and Spencer is considered to be 84.3% methane, 14.4% ethane, 0.5% carbon dioxide, and 0.8% nitrogen. However, many natural gas wells have produced almost pure methane (99%). Others have produced up to 88% ethane, 42% propane, 99% nitrogen, and 91% carbon dioxide. Using the accompanying average gas chart (Figure 5-11) is completely satisfactory is most cases. | + | According to Gerhardt-Owens (1970), average natural gas estimated by Stephens and Spencer is considered to be 84.3% methane, 14.4% ethane, 0.5% carbon dioxide, and 0.8% nitrogen. However, many [http://www.glossary.oilfield.slb.com/en/Terms/n/natural_gas.aspx natural gas] wells have produced almost pure methane (99%). Others have produced up to 88% ethane, 42% propane, 99% nitrogen, and 91% carbon dioxide. Using the accompanying average gas chart (Figure 5-11) is completely satisfactory is most cases. |
==Estimating subsurface gas density== | ==Estimating subsurface gas density== | ||
| Line 118: | Line 99: | ||
* [[Estimating static oil pressure gradients]] | * [[Estimating static oil pressure gradients]] | ||
* [[Plotting the hydrocarbon pressure gradient]] | * [[Plotting the hydrocarbon pressure gradient]] | ||
| − | * [[ | + | * [[Free water level determination using pressure]] |
| + | |||
| + | ==References== | ||
| + | {{reflist}} | ||
==External links== | ==External links== | ||
| Line 127: | Line 111: | ||
[[Category:Critical elements of the petroleum system]] | [[Category:Critical elements of the petroleum system]] | ||
[[Category:Formation fluid pressure and its application]] | [[Category:Formation fluid pressure and its application]] | ||
| + | [[Category:Treatise Handbook 3]] | ||
Latest revision as of 15:24, 17 February 2022
| Exploring for Oil and Gas Traps | |

| |
| Series | Treatise in Petroleum Geology |
|---|---|
| Part | Critical elements of the petroleum system |
| Chapter | Formation fluid pressure and its application |
| Author | Edward A. Beaumont, Forrest Fiedler |
| Link | Web page |
| Store | AAPG Store |
The static gas pressure of a gas reservoir is a function of gas density. Static gas pressure gradients can be estimated if subsurface gas density is known or has been estimated.
Subsurface gas density is dependent on the ratio of its mass to its volume. Mass is related to the apparent molecular weight of the gas. Volume is related to pressure, temperature, and the apparent molecular weight of the gas.
At atmospheric pressures and temperatures, gas density can be estimated using the Ideal Gas Law. At subsurface temperatures and pressures, gas molecules are so close to one another that they interact enough to change ideal gas behavior. A compressibility factor, z, is added to the Ideal Gas Law to correct for subsurface gas behavioral changes.
Procedure: estimating gas pressure gradient[edit]
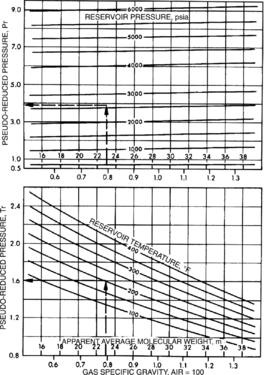
Figure 1 Pseudoreduced temperature and pressure. From Schowalter;[1] courtesy AAPG.
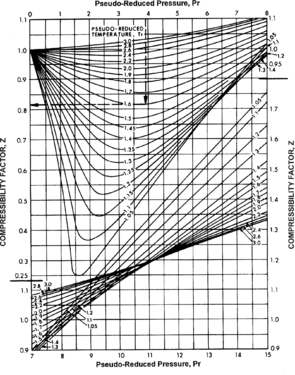
Figure 2 Estimate compressibility factor, z. From Schowalter;[1] courtesy AAPG.
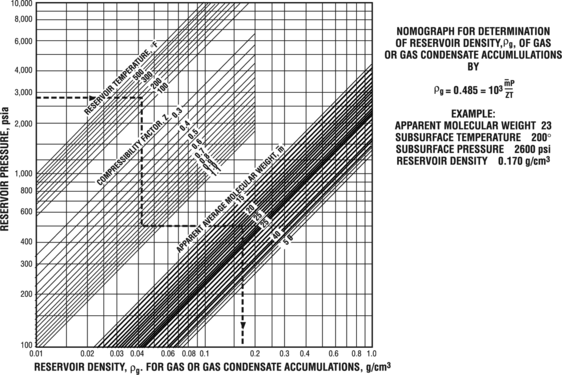
Figure 3 Estimate gas density. From Schowalter;[1] courtesy AAPG.
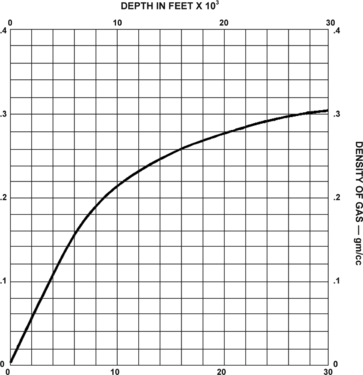
Figure 4 Average gas chart. Copyright: Gearhart-Owens.<ref name=G-O>Gearhart-Owens Industries, 1972, GO Log Interpretation Reference Data Handbook:


Follow this procedure to estimate the gas pressure gradient of a gas reservoir or potential gas reservoir.
- If data are available on gas composition and formation temperature go to step 2.
- If no data on gas composition or formation temperature are available, estimate gas density from the average gas chart (Figure 4) and go to Step 6.
- Determine the apparent molecular weight of the gas mixture.
- Read pseudoreduced temperature and pressure from Figure 1.
- If not already known, estimate compressibility factor, z , from Figure 2.
- Using information obtained from steps 2, 3, and 4, estimate gas density from Figure 3.
- Estimate gas pressure gradient using the following formula:
-
- where:
- Pgas grad = gas pressure gradient
- ρgas = gas density
-

Determining molecular weight[edit]
The apparent molecular weight of a gas mixture is equal to

where:
- MWapp = apparent molecular weight of the gas mixture
- MFx = mole fraction of a component of the mixture
- MWx = molecular weight of a component of the mixture
To practice, use these values for a gas mixture:
- Composition = 50% methane, 25% ethane, 25% propane
- Molecular weight of carbon (C) = 12
- Molecular weight of hydrogen (H) = 1
- Molecular weight of methane (CH4) = 12 + 4 = 16
- Molecular weight of ethane (C2H6) = 24 + 6 = 30
- Molecular weight of propane (C3H8) = 36 + 8 = 44

Determining z[edit]
The gas compressibility factor, z, for the gas reservoir of interest may already be known because it was measured. In this case, use that value. If z is not known, use the figure below to determine it from the pseudoreduced temperature and pressure determined from Figure 5-8. Figure 5-9 uses values determined for Figure 1
Determining subsurface gas density[edit]
We can determine gas density from the figure below, knowing reservoir pressure, reservoir temperature, gas compressibility factor, and apparent molecular weight.
Average natural gas[edit]
According to Gerhardt-Owens (1970), average natural gas estimated by Stephens and Spencer is considered to be 84.3% methane, 14.4% ethane, 0.5% carbon dioxide, and 0.8% nitrogen. However, many natural gas wells have produced almost pure methane (99%). Others have produced up to 88% ethane, 42% propane, 99% nitrogen, and 91% carbon dioxide. Using the accompanying average gas chart (Figure 5-11) is completely satisfactory is most cases.
Estimating subsurface gas density[edit]
We can estimate gas density from Figure 4. The chart assumes an average gas composition and was made using the following:
- Formation temperature = temperature::80°F plus 0.8° per length::100 ft of depth
- Formation fluid pressure gradient = 0.465 psi per ft of depth
- Supercompressibility factors used from George G. Brown, University of Michigan
The formula used to determine reduction in volume and the accompanying increase in density of a given gas (because of changes in temperature and pressure) is

where:
- V = volume, ft3
- V = original volume ft Pa = pressure, psia
- Pal = original pressure, psia
- Ta = absolute temperature, °R
- Tal = original absolute temperature, °R
- z = supercompressibility factor
- z1 = original supercompressibility factor
See also[edit]
- Static hydrocarbon pressure gradients
- Estimating static oil pressure gradients
- Plotting the hydrocarbon pressure gradient
- Free water level determination using pressure
References[edit]
- ↑ 1.0 1.1 1.2 Schowalter, T.T., 1979, Mechanics of secondary hydrocarbon migration and entrapment: AAPG Bulletin, vol. 63, no. 5, p. 723–760.
External links[edit]
| find literature about Static gas pressure gradient estimation |