Difference between revisions of "Scanning electron microscopy (SEM)"
| (7 intermediate revisions by 3 users not shown) | |||
| Line 1: | Line 1: | ||
{{publication | {{publication | ||
| − | | image = | + | | image = M102pc1197_450.jpg |
| series = Memoir 102 | | series = Memoir 102 | ||
| title = Electron microscopy of shale hydrocarbon reservoirs | | title = Electron microscopy of shale hydrocarbon reservoirs | ||
| Line 13: | Line 13: | ||
| isbn = 0891813835 | | isbn = 0891813835 | ||
}} | }} | ||
| − | The mechanics of the modern scanning electron microscope (SEM) system allow for various imaging and detecting techniques that can be used to study different aspects of the composition of | + | The mechanics of the modern scanning electron microscope (SEM) system allow for various imaging and detecting techniques that can be used to study different aspects of the composition of samples at very high resolution. Scanning electron microscopy, unlike conventional light microscopy, produces images by recording various signals resulting from interactions of an electron beam with the sample as it is scanned in a raster pattern across the sample surface. A fine electron probe, with a spot size from a few angstroms to several hundred nanometers, is generated by focusing electrons emanating from an electron source (conventionally called the electron gun) onto the surfaceof the specimen using a series of electro-optical lens elements. The combination of the source and the lens elements is called the electron column. |
[[File:Fig09.jpg|thumb|300px|SEM photomicrographs of seal types.<ref name=Snider_1997>Snider, Robert M., John S. Sneider, George W. Bolger, and John W. Neasham, 1997, [http://archives.datapages.com/data/specpubs/mem67/ch01/ch01.htm Comparison of seal capacity determinations: Conventional cores vs. cuttings], in Surdam, R. C., ed., Seals, Traps, and the Petroleum System: [http://store.aapg.org/detail.aspx?id=749 AAPG Memoir 67], pp. 1-12.</ref>]] | [[File:Fig09.jpg|thumb|300px|SEM photomicrographs of seal types.<ref name=Snider_1997>Snider, Robert M., John S. Sneider, George W. Bolger, and John W. Neasham, 1997, [http://archives.datapages.com/data/specpubs/mem67/ch01/ch01.htm Comparison of seal capacity determinations: Conventional cores vs. cuttings], in Surdam, R. C., ed., Seals, Traps, and the Petroleum System: [http://store.aapg.org/detail.aspx?id=749 AAPG Memoir 67], pp. 1-12.</ref>]] | ||
| Line 39: | Line 39: | ||
file:Figure-3.jpg|{{figure number|3}}A shale sample imaged using SE1 signal (left) and SE2 signal (right). Surface-specific information such as pore space and surface roughness is evident in the SE1 image. The SE2 image has more compositional influence, displaying organic matter (OM) bodies that are not evident in the SE1 image.<ref name=Huangetal_2013 /> | file:Figure-3.jpg|{{figure number|3}}A shale sample imaged using SE1 signal (left) and SE2 signal (right). Surface-specific information such as pore space and surface roughness is evident in the SE1 image. The SE2 image has more compositional influence, displaying organic matter (OM) bodies that are not evident in the SE1 image.<ref name=Huangetal_2013 /> | ||
file:M102Ch1Fg4.jpg|{{figure number|4}}SE2 (a) and BSE1 (b) image of a cross section of a shale rock. Note that the contrast between carbonate (ca) and silica (si) grains is much higher in BSE1; the topographical information is greater in the SE2 image (OM-associated nanopores are not visible in BSE1).<ref name=Huangetal_2013 /> | file:M102Ch1Fg4.jpg|{{figure number|4}}SE2 (a) and BSE1 (b) image of a cross section of a shale rock. Note that the contrast between carbonate (ca) and silica (si) grains is much higher in BSE1; the topographical information is greater in the SE2 image (OM-associated nanopores are not visible in BSE1).<ref name=Huangetal_2013 /> | ||
| − | file:M102Ch1Fg5.jpg|{{figure number|5}}A BSE2 image of gold (Au) nanoparticles showing crystallographic contrast.<ref name=Huangetal_2013 /> | + | file:M102Ch1Fg5.jpg|{{figure number|5}}A BSE2 image of gold (Au) nanoparticles showing crystallographic contrast.<ref name=Huangetal_2013 /> |
</gallery> | </gallery> | ||
===SEM image examples=== | ===SEM image examples=== | ||
| − | [[:file:Figure-3.jpg|Figure 3]] shows an SE1 image of a shale sample. At low landing energy (less than 1 keV), the secondary electrons collected with the in-lens detector originate from the very surface of the sample. The SE1 signal is commonly used to image surface details at the highest resolution at the expense of compositional information. On the right side of Figure 3, the SE2 image of the same area as the SE1 image on the left shows the | + | [[:file:Figure-3.jpg|Figure 3]] shows an SE1 image of a [[shale]] sample. At low landing energy (less than 1 keV), the secondary electrons collected with the in-lens detector originate from the very surface of the sample. The SE1 signal is commonly used to image surface details at the highest resolution at the expense of compositional information. On the right side of Figure 3, the SE2 image of the same area as the SE1 image on the left shows the |
effects of higher landing energy and deeper specimen interaction, including more compositional and less topographical information. | effects of higher landing energy and deeper specimen interaction, including more compositional and less topographical information. | ||
| − | [[:file:M102Ch1Fg4.jpg|Figure 4]]a shows an SE2 image of a cross section of a shale sample that has been polished by argon-ion milling, a sample preparation technique that consists of using one or more beams of argon ions to gently polish the surface of a sample by sputtering away material, thus providing an extremely smooth surface for SEM investigation. The image was acquired with an Everhart-Thornley type secondary electron detector. | + | [[:file:M102Ch1Fg4.jpg|Figure 4]]a shows an SE2 image of a [[cross section]] of a shale sample that has been polished by argon-ion milling, a sample preparation technique that consists of using one or more beams of argon ions to gently polish the surface of a sample by sputtering away material, thus providing an extremely smooth surface for SEM investigation. The image was acquired with an Everhart-Thornley type secondary electron detector. |
| − | The SE2 image contrast reveals both topographical and compositional information due to the greater sample interaction depth of SE2 electrons. High SE yield is scaled as lighter shades of gray, and low SE yield is scaled as dark shades of gray in SEM images. Pores and | + | The SE2 image contrast reveals both topographical and compositional information due to the greater sample interaction depth of SE2 electrons. High SE yield is scaled as lighter shades of gray, and low SE yield is scaled as dark shades of gray in SEM images. Pores and [[fracture]]s appear dark in the SE2 image, reflecting lower secondary electron yield from negative depressions than from elsewhere on the sample surface. Therefore, [[porosity]] information can be readily characterized with the SE2 electrons. |
| − | The same cross section was imaged with BSE1 with the | + | The same cross section was imaged with BSE1 with the energy-selective backscatter (EsB) detector (Figure 4b). The image contrast (grayscale variation) reflects compositional variations (mean atomic number) of the sample. For example, the midgray represents [[silica]] matrix; the darker level represents organic matter. The brighter gray level reflects higher density [[carbonate]] phases, and the brightest gray level represents [[pyrite]]. Note the greater compositional contrast provided by the BS1 image (Figure 4b) over the SE2 image (Figure 4a). Although SE2 and BS1 images are capable of providing compositional information, auxiliary techniques, such as energy-dispersive x-ray spectrometry (EDS), are required to characterize elemental composition. |
| − | Compared to BSE1, for which the contrast is modulated by mean atomic number differences, BSE2 yield depends strongly on crystalline structures such as grain orientations. [[:file:M102Ch1Fg5.jpg|Figure 5]] shows a BSE2 image of gold (Au) nanoparticles. Contrast corresponding to different grains is revealed in the image despite all the chemically identical grains. Therefore, BSE2 electrons can be used to image crystallographic contrast in polycrystalline materials. | + | Compared to BSE1, for which the contrast is modulated by mean atomic number differences, BSE2 yield depends strongly on crystalline structures such as grain orientations. [[:file:M102Ch1Fg5.jpg|Figure 5]] shows a BSE2 image of [[gold]] (Au) nanoparticles. Contrast corresponding to different grains is revealed in the image despite all the chemically identical grains. Therefore, BSE2 electrons can be used to image crystallographic contrast in polycrystalline materials. |
<gallery mode=packed heights=200px widths=200px> | <gallery mode=packed heights=200px widths=200px> | ||
| − | file:M102Ch1Fg6.jpg|{{figure number|6}}(a) A BSE and CL image of a polished shale sample. Orange-hued quartz grains reflect low-grade metamorphic origin (slate); blue-hued quartz grains indicate higher grade metamorphism (phyllite-schist). (b) Detail of a large quartz grain in center of image (arrow) displays multiple generations of growth in CL; this distinction in zoning is not visible in SEM.<ref name=Huangetal_2013 /> | + | file:M102Ch1Fg6.jpg|{{figure number|6}}(a) A BSE and CL image of a polished shale sample. Orange-hued [[quartz]] grains reflect low-grade metamorphic origin (slate); blue-hued quartz grains indicate higher grade metamorphism (phyllite-schist). (b) Detail of a large quartz grain in center of image (arrow) displays multiple generations of growth in CL; this distinction in zoning is not visible in SEM.<ref name=Huangetal_2013 /> |
file:M102Ch1Fg7.jpg|{{figure number|7}}An example of an x-ray spectrum acquired from a shale sample. Individual peaks indicate an elevated concentration of a given element. C=carbon, O=oxygen, Mg=magnesium, Al=aluminum, Si=silicon, Ca=calcium.<ref name=Huangetal_2013 /> | file:M102Ch1Fg7.jpg|{{figure number|7}}An example of an x-ray spectrum acquired from a shale sample. Individual peaks indicate an elevated concentration of a given element. C=carbon, O=oxygen, Mg=magnesium, Al=aluminum, Si=silicon, Ca=calcium.<ref name=Huangetal_2013 /> | ||
</gallery> | </gallery> | ||
| − | Another complimentary technique is the detection of CL, in which certain materials will emit photons in the form of visible light as a result of interactions between specimen electrons and primary beam electrons. [[:file:M102Ch1Fg6.jpg|Figure 6]] shows an example of the effects of CL on a shale sample. The image was acquired with a dedicated CL detector. Variations in CL emission caused by mineral impurities could indicate provenance of individual quartz grains. Cathodoluminescence can also be used to differentiate between generations of quartz growth that are not distinguishable in SEM due to identical mean atomic number. | + | Another complimentary technique is the detection of CL, in which certain materials will emit photons in the form of visible light as a result of interactions between specimen electrons and primary beam electrons. [[:file:M102Ch1Fg6.jpg|Figure 6]] shows an example of the effects of CL on a shale sample. The image was acquired with a dedicated CL detector. Variations in CL emission caused by mineral impurities could indicate provenance of individual [[quartz]] grains. Cathodoluminescence can also be used to differentiate between generations of quartz growth that are not distinguishable in SEM due to identical mean atomic number. |
==X-ray microanalysis== | ==X-ray microanalysis== | ||
| Line 66: | Line 66: | ||
<gallery mode=packed heights=200px widths=200px> | <gallery mode=packed heights=200px widths=200px> | ||
| − | file:Figure-8.jpg|{{figure number|8}}A secondary electron image of a shale sample with an EDS-derived mineral segmentation overlay. In the segmented region, blue = carbonate, green = clay minerals, yellow = quartz, pink = feldspar, white = pyrite, and gray = organic matter.<ref name=Huangetal_2013 /> | + | file:Figure-8.jpg|{{figure number|8}}A secondary electron image of a shale sample with an EDS-derived mineral segmentation overlay. In the segmented region, blue = carbonate, green = clay minerals, yellow = [[quartz]], pink = feldspar, white = pyrite, and gray = organic matter.<ref name=Huangetal_2013 /> |
file:Figure-9.jpg|{{figure number|9}}At left, a schematic diagram of operation of an FIB-SEM system. The FIB sputters away a thin layer of the sample at a time, while the electron beam/detector system captures an image of each newly exposed surface. At right, a picture of a commercial FIB-SEM CrossBeam™ system, Auriga.<ref name=Huangetal_2013 /> | file:Figure-9.jpg|{{figure number|9}}At left, a schematic diagram of operation of an FIB-SEM system. The FIB sputters away a thin layer of the sample at a time, while the electron beam/detector system captures an image of each newly exposed surface. At right, a picture of a commercial FIB-SEM CrossBeam™ system, Auriga.<ref name=Huangetal_2013 /> | ||
</gallery> | </gallery> | ||
| Line 74: | Line 74: | ||
==Focused ion beam applications== | ==Focused ion beam applications== | ||
| − | Focused ion beam (FIB) systems also find a growing number of applications in geology.<ref name=Goldsteinetal_2003 /> In a typical FIB-SEM system, an extraction field is applied to a gallium (Ga) liquid metal ion source to field emit Ga ions and form a Ga beam. Due to the higher atomic mass, the Ga beam not only can be used to generate electron and ion images, but also may be used to mill samples to remove material. [[:file:Figure-9.jpg|Figure 9a]] shows the schematic diagram of an FIB-SEM system where a cross section of the sample is milled by a Ga FIB beam and is imaged simultaneously by the SEM. This milling and imaging process can be automated in a serial fashion to acquire a stack of two-dimensional images, from which a 3-D image volume can be constructed from the data set. This technique is particularly useful in revealing the 3-D distribution of mineral types, organic matter, porosity, and the like in shale (and other rock) samples. | + | Focused ion beam (FIB) systems also find a growing number of applications in geology.<ref name=Goldsteinetal_2003 /> In a typical FIB-SEM system, an extraction field is applied to a gallium (Ga) liquid metal ion source to field emit Ga ions and form a Ga beam. Due to the higher atomic mass, the Ga beam not only can be used to generate electron and ion images, but also may be used to mill samples to remove material. [[:file:Figure-9.jpg|Figure 9a]] shows the schematic diagram of an FIB-SEM system where a [[cross section]] of the sample is milled by a Ga FIB beam and is imaged simultaneously by the SEM. This milling and imaging process can be automated in a serial fashion to acquire a stack of two-dimensional images, from which a 3-D image volume can be constructed from the data set. This technique is particularly useful in revealing the 3-D distribution of mineral types, organic matter, porosity, and the like in shale (and other rock) samples. |
Scanning electron microscopy provides different modes and techniques for acquiring high-quality images of shale and other rock samples. The images in this chapter demonstrate their fine resolution and their applicability for the characterization of shale reservoirs. | Scanning electron microscopy provides different modes and techniques for acquiring high-quality images of shale and other rock samples. The images in this chapter demonstrate their fine resolution and their applicability for the characterization of shale reservoirs. | ||
| Line 80: | Line 80: | ||
==References== | ==References== | ||
{{reflist}} | {{reflist}} | ||
| + | |||
| + | ==External links== | ||
| + | {{search}} | ||
| + | * [http://store.aapg.org/detail.aspx?id=1197 Find the book in the AAPG Store] | ||
| + | |||
[[Category:Laboratory methods]] | [[Category:Laboratory methods]] | ||
Latest revision as of 20:24, 23 January 2019
| Electron microscopy of shale hydrocarbon reservoirs | |

| |
| Series | Memoir 102 |
|---|---|
| Chapter | An introduction to SEM operational principles and geologic applications for shale hydrocarbon reservoirs |
| Author | Jason Huang, Timothy Cavanaugh, and Boaz Nur |
| Store | AAPG Store |
The mechanics of the modern scanning electron microscope (SEM) system allow for various imaging and detecting techniques that can be used to study different aspects of the composition of samples at very high resolution. Scanning electron microscopy, unlike conventional light microscopy, produces images by recording various signals resulting from interactions of an electron beam with the sample as it is scanned in a raster pattern across the sample surface. A fine electron probe, with a spot size from a few angstroms to several hundred nanometers, is generated by focusing electrons emanating from an electron source (conventionally called the electron gun) onto the surfaceof the specimen using a series of electro-optical lens elements. The combination of the source and the lens elements is called the electron column.
Introduction
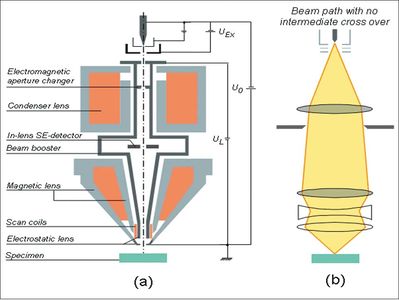
Figure 1 Schematic diagram of the GEMINI™ electron column (a) and the electron beam path in the column (b).[2]
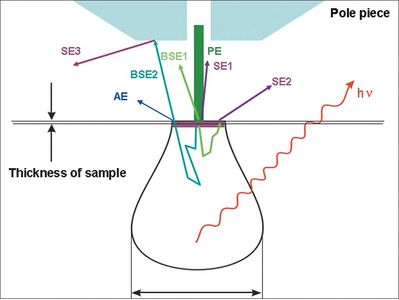
Figure 2 Profile view of a typical specimen-electron interaction volume. Note that secondary electrons (SE) originate much shallower in the sample than backscattered electrons (BSE) and therefore provide more surface-driven and less composition-influenced information.[2]
Figure 1a shows an example schematic diagram of a state-of-the-art electron column. The column shown here is the Zeiss GEMINI™ column. The ray path of the electrons is illustrated in Figure 1b. Specifically, electrons are emitted from a very fine heated filament with a high electrostatic extraction potential. The electrons are then immediately accelerated to a desired kinetic energy and propagate down the electron column. In the GEMINI column, a very simple two-lens system is employed to focus the electron beam. The upper lens, or the condenser lens, first demagnifies the emitted electrons to some extent. Next, some of the electrons are cut off by an aperture. The focusing strength of the condenser lens and the size of the aperture determine the beam current in the final spot. A final objective lens assembly then focuses the beam down to the desirable spot size. Depending on manufacturer design, the lenses used in the column can be magnetic or electrostatic (or a combination of the two types). In the case of the GEMINI column, the final objective lens is a combination of magnetic and electrostatic lenses. The main advantage of such a design is that there is virtually no magnetic field on the specimen that could distort the imaging if the specimen is magnetic.
The earliest work describing the concept of SEM is that of Knoll in 1935.[3] In his work, the focused electron beam was generated to image a metal plate with a transmission signal. The first SEM used to examine thick specimens was described by Zworykin at the RCA Laboratories in 1942.[3] Everhart and Thornley improved on Zworykin’s original design by employing a scintillator to convert the electrons to light, which was then transmitted by a light pipe directly to a photomultiplier. The Everhart-Thornley detector greatly improves the signal-to-noise ratio of SEM imaging. The first commercial instrument was built in 1963 by Pease at Cambridge Scientific Instruments.[3]
Since the first commercial instruments, many advances have been made, including development of a high-brightness electron gun allowing more electrons to be focused into a smaller beam spot, an improved electron optics design that can dramatically enhance imaging resolution, and a large portfolio of detectors that capture and separate different types of information generated by the primary electron beam. A more detailed description of a detection mechanism related to imaging contrast is elaborated in the following section.
SEM contract mechanisms
Several types of electrons are generated as the result of the energetic bombardment of the specimen by the primary beam (Figure 2). All of these electrons carry distinct structural information about the sample and differ from one another in origin, energy, and traveling direction. For example, type I secondary electrons (SE1) emit with a high angle at a close proximity from the impact point and therefore carry high-resolution, surface-sensitive (topographic) information of the sample. Type II secondary electrons (SE2), however, are generated from a deeper and wider volume than the SE1 and reflect at a lower angle, therefore carrying intrinsically lower-resolution topographical information. Similarly, singly scattered backscattered electrons (BSE1) tend to emit at a high angle and are closely linked to compositional contrast, while multiply scattered BSE (BSE2) take off at a lower angle and are used to characterize composition and crystalline structures of a sample. Photons can also be generated from the excitation by the primary electron beam. For example, x-rays with a continuous spectrum in energy (bremsstrahlung) are generated as a result of the deceleration of the electrons. Additionally, characteristic x-ray lines are generated from electron excitation within specimen atoms that interact with the primary electron beam. The latter form of x-ray is particularly useful in chemical analysis with SEM.
Photons with wavelengths in the ultraviolet, visible, and infrared light regions of the electromagnetic spectrum can also be excited by the primary electrons. This phenomenon is called cathodoluminescence (CL). The generation of CL is commonly associated with the presence of certain trace impurities in minerals and therefore is also widely used in geological applications. A few examples are illustrated next to demonstrate several common contrast mechanisms useful for the geological study of shales.
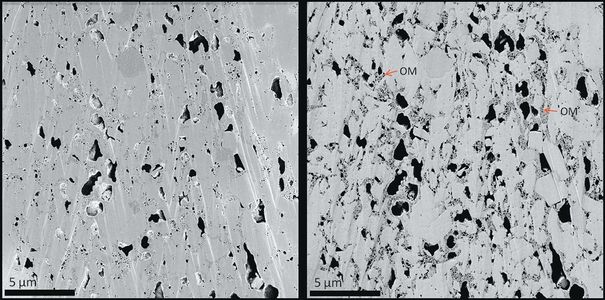
Figure 3 A shale sample imaged using SE1 signal (left) and SE2 signal (right). Surface-specific information such as pore space and surface roughness is evident in the SE1 image. The SE2 image has more compositional influence, displaying organic matter (OM) bodies that are not evident in the SE1 image.[2]
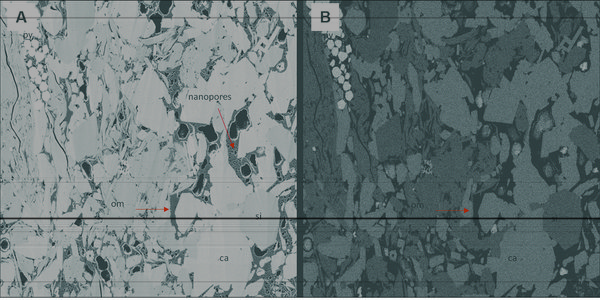
Figure 4 SE2 (a) and BSE1 (b) image of a cross section of a shale rock. Note that the contrast between carbonate (ca) and silica (si) grains is much higher in BSE1; the topographical information is greater in the SE2 image (OM-associated nanopores are not visible in BSE1).[2]
Figure 5 A BSE2 image of gold (Au) nanoparticles showing crystallographic contrast.[2]
SEM image examples
Figure 3 shows an SE1 image of a shale sample. At low landing energy (less than 1 keV), the secondary electrons collected with the in-lens detector originate from the very surface of the sample. The SE1 signal is commonly used to image surface details at the highest resolution at the expense of compositional information. On the right side of Figure 3, the SE2 image of the same area as the SE1 image on the left shows the effects of higher landing energy and deeper specimen interaction, including more compositional and less topographical information.
Figure 4a shows an SE2 image of a cross section of a shale sample that has been polished by argon-ion milling, a sample preparation technique that consists of using one or more beams of argon ions to gently polish the surface of a sample by sputtering away material, thus providing an extremely smooth surface for SEM investigation. The image was acquired with an Everhart-Thornley type secondary electron detector. The SE2 image contrast reveals both topographical and compositional information due to the greater sample interaction depth of SE2 electrons. High SE yield is scaled as lighter shades of gray, and low SE yield is scaled as dark shades of gray in SEM images. Pores and fractures appear dark in the SE2 image, reflecting lower secondary electron yield from negative depressions than from elsewhere on the sample surface. Therefore, porosity information can be readily characterized with the SE2 electrons.
The same cross section was imaged with BSE1 with the energy-selective backscatter (EsB) detector (Figure 4b). The image contrast (grayscale variation) reflects compositional variations (mean atomic number) of the sample. For example, the midgray represents silica matrix; the darker level represents organic matter. The brighter gray level reflects higher density carbonate phases, and the brightest gray level represents pyrite. Note the greater compositional contrast provided by the BS1 image (Figure 4b) over the SE2 image (Figure 4a). Although SE2 and BS1 images are capable of providing compositional information, auxiliary techniques, such as energy-dispersive x-ray spectrometry (EDS), are required to characterize elemental composition.
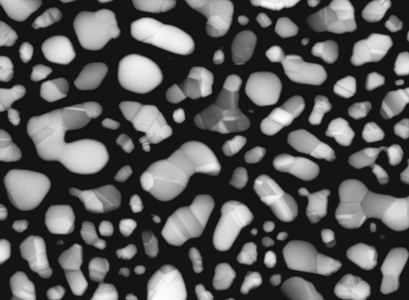
Compared to BSE1, for which the contrast is modulated by mean atomic number differences, BSE2 yield depends strongly on crystalline structures such as grain orientations. Figure 5 shows a BSE2 image of gold (Au) nanoparticles. Contrast corresponding to different grains is revealed in the image despite all the chemically identical grains. Therefore, BSE2 electrons can be used to image crystallographic contrast in polycrystalline materials.
Figure 6 (a) A BSE and CL image of a polished shale sample. Orange-hued quartz grains reflect low-grade metamorphic origin (slate); blue-hued quartz grains indicate higher grade metamorphism (phyllite-schist). (b) Detail of a large quartz grain in center of image (arrow) displays multiple generations of growth in CL; this distinction in zoning is not visible in SEM.[2]
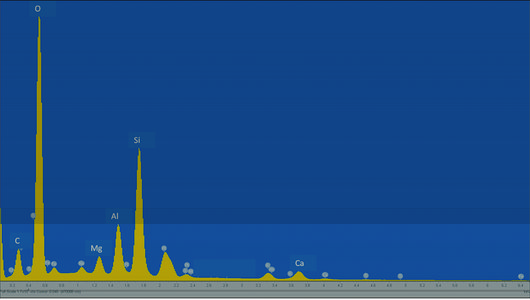
Figure 7 An example of an x-ray spectrum acquired from a shale sample. Individual peaks indicate an elevated concentration of a given element. C=carbon, O=oxygen, Mg=magnesium, Al=aluminum, Si=silicon, Ca=calcium.[2]
Another complimentary technique is the detection of CL, in which certain materials will emit photons in the form of visible light as a result of interactions between specimen electrons and primary beam electrons. Figure 6 shows an example of the effects of CL on a shale sample. The image was acquired with a dedicated CL detector. Variations in CL emission caused by mineral impurities could indicate provenance of individual quartz grains. Cathodoluminescence can also be used to differentiate between generations of quartz growth that are not distinguishable in SEM due to identical mean atomic number.
X-ray microanalysis
Both the bremsstrahlung (continuum) and characteristics x-rays are produced by electron beam-sample interactions. The characteristic x-rays originate from the inner-shell ionization process, where an electron from the electron beam interacts with the tightly bound inner-shell electrons, ejecting an atomic electron and leaving a vacancy in that shell. The atom relaxes to its ground state through a limited set of transitions of outer-shell electrons to fill the inner-shell vacancy. The energies of the electrons in the shells are sharply defined, with values characteristic of the binding energies of the electrons; therefore, the characteristic x-rays are elemental specific, creating a powerful tool for elemental analysis in SEM. A typical x-ray spectrum is shown in Figure 7, which was acquired from a shale sample. In the spectrum, the broad, continuous background is the bremsstrahlung; the sharp peaks correspond to the elemental lines associated with specific intershell transitions.
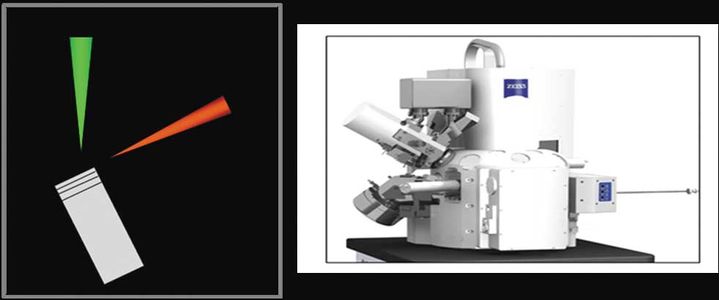
Figure 9 At left, a schematic diagram of operation of an FIB-SEM system. The FIB sputters away a thin layer of the sample at a time, while the electron beam/detector system captures an image of each newly exposed surface. At right, a picture of a commercial FIB-SEM CrossBeam™ system, Auriga.[2]
To take advantage of the element-specific information caused by x-ray excitation, EDS (or EDX) can be performed. As the electron beam scans the sample surface pixel by pixel, a full x-ray spectrum can be acquired from each pixel. Elemental distribution can therefore be mapped using the relative peak intensity to build an image of the scanned area. This can then be interpreted to estimate mineral phase composition. Figure 8 shows a secondary electron image of a shale sample with EDS-derived mineral segmentation of the same region.
Focused ion beam applications
Focused ion beam (FIB) systems also find a growing number of applications in geology.[3] In a typical FIB-SEM system, an extraction field is applied to a gallium (Ga) liquid metal ion source to field emit Ga ions and form a Ga beam. Due to the higher atomic mass, the Ga beam not only can be used to generate electron and ion images, but also may be used to mill samples to remove material. Figure 9a shows the schematic diagram of an FIB-SEM system where a cross section of the sample is milled by a Ga FIB beam and is imaged simultaneously by the SEM. This milling and imaging process can be automated in a serial fashion to acquire a stack of two-dimensional images, from which a 3-D image volume can be constructed from the data set. This technique is particularly useful in revealing the 3-D distribution of mineral types, organic matter, porosity, and the like in shale (and other rock) samples.
Scanning electron microscopy provides different modes and techniques for acquiring high-quality images of shale and other rock samples. The images in this chapter demonstrate their fine resolution and their applicability for the characterization of shale reservoirs.
References
- ↑ Snider, Robert M., John S. Sneider, George W. Bolger, and John W. Neasham, 1997, Comparison of seal capacity determinations: Conventional cores vs. cuttings, in Surdam, R. C., ed., Seals, Traps, and the Petroleum System: AAPG Memoir 67, pp. 1-12.
- ↑ 2.0 2.1 2.2 2.3 2.4 2.5 2.6 2.7 2.8 Huang, Jason, Timothy Cavanaugh, and Boaz Nur, 2013, An introduction to SEM operational principles and geologic applications for shale hydrocarbon reservoirs, in W. Camp, E. Diaz, and B. Wawak, eds., Electron Microscopy of Shale Hydrocarbon Reservoirs: AAPG Memoir 102, 260 pp.
- ↑ 3.0 3.1 3.2 3.3 Goldstein, J., D. E. Newbury, D. C. Joy, C. E. Lyman, P. Echlin, E. Lifshin, L. Sawyer, and J. R. Michael, 2003, Scanning electron microscopy and x-ray microanalysis, 3rd ed.: New York, Springer, 695 p.
