Difference between revisions of "Magnetotelluric data acquisition"
FWhitehurst (talk | contribs) |
Cwhitehurst (talk | contribs) m (added Category:Treatise Handbook 3 using HotCat) |
||
| (18 intermediate revisions by 2 users not shown) | |||
| Line 6: | Line 6: | ||
| part = Predicting the occurrence of oil and gas traps | | part = Predicting the occurrence of oil and gas traps | ||
| chapter = Applying magnetotellurics | | chapter = Applying magnetotellurics | ||
| − | | frompg = 16- | + | | frompg = 16-6 |
| − | | topg = 16- | + | | topg = 16-7 |
| author = Arnie Ostrander | | author = Arnie Ostrander | ||
| link = http://archives.datapages.com/data/specpubs/beaumont/ch16/ch16.htm | | link = http://archives.datapages.com/data/specpubs/beaumont/ch16/ch16.htm | ||
| Line 16: | Line 16: | ||
==Acquisition instrumentation== | ==Acquisition instrumentation== | ||
| − | The data are collected using a microprocessor-controlled voltmeter. The voltmeter is in fact a system of complex hardware | + | The data are collected using a microprocessor-controlled voltmeter. The voltmeter is in fact a system of complex hardware and software devices that includes amplification, filtering, analog to digital conversion, stacking and averaging, and various data-enhancement algorithms. |
==Types of surveys== | ==Types of surveys== | ||
| − | There are two types of MT surveys: natural source.<ref name=ch16r6>Vozoff, K., 1972, The magnetotelluric method in the exploration of sedimentary basins: Geophysics, vol. 37, no. 1, p. 98–141., 10., 1190/1., 1440255</ref> and controlled source<ref name=ch16r3>Goldstein, M. | + | There are two types of magnetotelluric (MT) surveys: natural source.<ref name=ch16r6>Vozoff, K., 1972, The magnetotelluric method in the exploration of sedimentary basins: Geophysics, vol. 37, no. 1, p. 98–141., 10., 1190/1., 1440255</ref> and controlled source<ref name=ch16r3>Goldstein, M. A., and D. W. Strangway, 1975, Audio-frequency magnetotellurics with a grounded electrical dipole source: Geophysics, vol. 40, p. 669–683., 10., 1190/1., 1440558</ref> The equipment and the operational procedures for these two types differ considerably. |
==Natural-source surveys== | ==Natural-source surveys== | ||
| − | [[file:applying-magnetotellurics_fig16-3.png|thumb|{{figure number|1}}Typical MT setup for a natural-source survey.]] | + | [[file:applying-magnetotellurics_fig16-3.png|300px|thumb|{{figure number|1}}Typical MT setup for a natural-source survey.]] |
| − | The natural-source data-acquisition system typically measures four components: E<sub>x</sub>, E<sub>y</sub>, H<sub>x</sub>, and H<sub>y</sub>. The E<sub>x</sub> component is oriented perpendicular to the E<sub>y</sub> component. This is also true for the H-field components. | + | The natural-source data-acquisition system typically measures four components: two in the horizontal field, E<sub>x</sub>, E<sub>y</sub>, and two in the electrical field, H<sub>x</sub>, and H<sub>y</sub>. (See [[Magnetotellurics survey measurements]].) The E<sub>x</sub> component is oriented perpendicular to the E<sub>y</sub> component. This is also true for the H-field components. |
The predominant low-frequency ( 1.0 Hz) source is equatorial thunderstorm activity. | The predominant low-frequency ( 1.0 Hz) source is equatorial thunderstorm activity. | ||
| Line 35: | Line 35: | ||
==Controlled-source surveys== | ==Controlled-source surveys== | ||
| − | [[file:applying-magnetotellurics_fig16-4.png|thumb|{{figure number|2}}Typical MT setup for a controlled-source survey.]] | + | [[file:applying-magnetotellurics_fig16-4.png|thumb|300px|{{figure number|2}}Typical MT setup for a controlled-source survey.]] |
| − | The controlled-source system uses a high-power transmitter and motor | + | The controlled-source system uses a high-power transmitter and motor or generator set to transmit a discrete alternating current waveform. This signal is transmitted into a grounded dipole typically 600–1,200 m (2,000–4,000 ft) long. The transmitter is normally located 3–6 km (2–4 mi) from the survey line. |
Normally, only the E<sub>x</sub> (parallel to the transmitter dipole) and H<sub>y</sub> components are measured. | Normally, only the E<sub>x</sub> (parallel to the transmitter dipole) and H<sub>y</sub> components are measured. | ||
| Line 44: | Line 44: | ||
==Which method is better?== | ==Which method is better?== | ||
| − | The choice of MT method depends on the survey objectives. Natural-source data are best suited for regional surveys where the stations are widely spaced (e.g., frontier basin analysis). Controlled-source data are best suited for mapping structural detail where the stations lie along a continuous profile at 100–200-m (300–600-ft) spacings. The maximum depth of exploration for the controlled-source method is 3,000–4,500 m (10,000–15,000 ft) in a typical volcanic, carbonate, or granite overthrust terrain. Natural-source data have considerably deeper penetration but poorer resolution at shallower depths. | + | The choice of MT method depends on the survey objectives. Natural-source data are best suited for regional surveys where the stations are widely spaced (e.g., frontier basin analysis; see [[Magnetotellurics case history: frontier basin analysis (Amazon Basin, Colombia)]]). Controlled-source data are best suited for mapping structural detail where the stations lie along a continuous profile at 100–200-m (300–600-ft) spacings. The maximum depth of exploration for the controlled-source method is 3,000–4,500 m (10,000–15,000 ft) in a typical [[Wikipedia:Volcanic_rock|volcanic]], [[carbonate]], or [http://geology.about.com/od/more_igrocks/a/granite.htm granite] [[Thrust belt|overthrust]] terrain. Natural-source data have considerably deeper penetration but poorer resolution at shallower depths. |
==Where to use MT== | ==Where to use MT== | ||
| Line 51: | Line 51: | ||
{| class = "wikitable" | {| class = "wikitable" | ||
|- | |- | ||
| − | ! Locations | + | ! Locations || Reasons for Using MT |
| − | |||
|- | |- | ||
| − | | Carbonate terrains | + | | Carbonate terrains || Poor-quality seismic data |
| − | | Poor-quality seismic data | ||
|- | |- | ||
| − | | Volcanic terrains | + | | Volcanic terrains || Poor-quality seismic data |
| − | | Poor-quality seismic data | ||
|- | |- | ||
| − | | Granite overthrusts | + | | Granite overthrusts || Poor-quality seismic data |
| − | | Poor-quality seismic data | ||
|- | |- | ||
| − | | Regional surveys | + | | Regional surveys || Less expensive than seismic; generates prospects to detail with seismic |
| − | | Less expensive than seismic; generates prospects to detail with seismic | ||
|- | |- | ||
| − | | Remote areas | + | | Remote areas || Less expensive than seismic |
| − | | Less expensive than seismic | ||
|- | |- | ||
| − | | Rugged terrains | + | | Rugged terrains || Less expensive than seismic |
| − | | Less expensive than seismic | ||
|- | |- | ||
| − | | Fracture zones | + | | [[Fracture]] zones || Excellent tool for mapping |
| − | | Excellent tool for mapping | ||
|} | |} | ||
==See also== | ==See also== | ||
| + | * [[Magnetotellurics]] | ||
* [[Magnetotellurics survey measurements]] | * [[Magnetotellurics survey measurements]] | ||
* [[Magnetotellurics case history: frontier basin analysis (Amazon Basin, Colombia)]] | * [[Magnetotellurics case history: frontier basin analysis (Amazon Basin, Colombia)]] | ||
| − | * [[ | + | * [[Magnetotellurics case history: rugged carbonate terrain (Highlands of Papua New Guinea)]] |
| − | * [[ | + | * [[Magnetotellurics case history: Precambrian overthrust (Northwestern Colorado)]] |
| − | * [[ | + | * [[Magnetotellurics case history: volcanic terrain (Columbia River Plateau)]] |
==References== | ==References== | ||
| Line 93: | Line 86: | ||
[[Category:Predicting the occurrence of oil and gas traps]] | [[Category:Predicting the occurrence of oil and gas traps]] | ||
[[Category:Applying magnetotellurics]] | [[Category:Applying magnetotellurics]] | ||
| + | [[Category:Treatise Handbook 3]] | ||
Latest revision as of 15:11, 31 January 2022
| Exploring for Oil and Gas Traps | |

| |
| Series | Treatise in Petroleum Geology |
|---|---|
| Part | Predicting the occurrence of oil and gas traps |
| Chapter | Applying magnetotellurics |
| Author | Arnie Ostrander |
| Link | Web page |
| Store | AAPG Store |
Acquisition instrumentation[edit]
The data are collected using a microprocessor-controlled voltmeter. The voltmeter is in fact a system of complex hardware and software devices that includes amplification, filtering, analog to digital conversion, stacking and averaging, and various data-enhancement algorithms.
Types of surveys[edit]
There are two types of magnetotelluric (MT) surveys: natural source.[1] and controlled source[2] The equipment and the operational procedures for these two types differ considerably.
Natural-source surveys[edit]
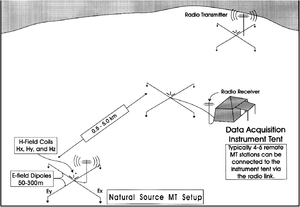
The natural-source data-acquisition system typically measures four components: two in the horizontal field, Ex, Ey, and two in the electrical field, Hx, and Hy. (See Magnetotellurics survey measurements.) The Ex component is oriented perpendicular to the Ey component. This is also true for the H-field components.
The predominant low-frequency ( 1.0 Hz) source is equatorial thunderstorm activity.
Although H-field data do not provide information on the subsurface geology (when only Hx and Hy components are measured), the vertical H-field component—if measured—provides information on the surface geology.
Figure 1 shows a typical MT setup for a natural-source survey.
Controlled-source surveys[edit]
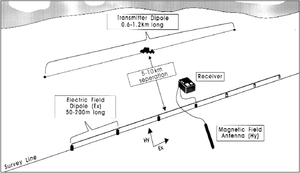
The controlled-source system uses a high-power transmitter and motor or generator set to transmit a discrete alternating current waveform. This signal is transmitted into a grounded dipole typically 600–1,200 m (2,000–4,000 ft) long. The transmitter is normally located 3–6 km (2–4 mi) from the survey line.
Normally, only the Ex (parallel to the transmitter dipole) and Hy components are measured.
Figure 2 shows a typical MT setup for a controlled-source survey.
Which method is better?[edit]
The choice of MT method depends on the survey objectives. Natural-source data are best suited for regional surveys where the stations are widely spaced (e.g., frontier basin analysis; see Magnetotellurics case history: frontier basin analysis (Amazon Basin, Colombia)). Controlled-source data are best suited for mapping structural detail where the stations lie along a continuous profile at 100–200-m (300–600-ft) spacings. The maximum depth of exploration for the controlled-source method is 3,000–4,500 m (10,000–15,000 ft) in a typical volcanic, carbonate, or granite overthrust terrain. Natural-source data have considerably deeper penetration but poorer resolution at shallower depths.
Where to use MT[edit]
MT can be valuable in areas that yield poor-quality seismic data and where acquiring seismic data is very expensive. The following table indicates where to use MT and the reasons for using it.
| Locations | Reasons for Using MT |
|---|---|
| Carbonate terrains | Poor-quality seismic data |
| Volcanic terrains | Poor-quality seismic data |
| Granite overthrusts | Poor-quality seismic data |
| Regional surveys | Less expensive than seismic; generates prospects to detail with seismic |
| Remote areas | Less expensive than seismic |
| Rugged terrains | Less expensive than seismic |
| Fracture zones | Excellent tool for mapping |
See also[edit]
- Magnetotellurics
- Magnetotellurics survey measurements
- Magnetotellurics case history: frontier basin analysis (Amazon Basin, Colombia)
- Magnetotellurics case history: rugged carbonate terrain (Highlands of Papua New Guinea)
- Magnetotellurics case history: Precambrian overthrust (Northwestern Colorado)
- Magnetotellurics case history: volcanic terrain (Columbia River Plateau)
References[edit]
- ↑ Vozoff, K., 1972, The magnetotelluric method in the exploration of sedimentary basins: Geophysics, vol. 37, no. 1, p. 98–141., 10., 1190/1., 1440255
- ↑ Goldstein, M. A., and D. W. Strangway, 1975, Audio-frequency magnetotellurics with a grounded electrical dipole source: Geophysics, vol. 40, p. 669–683., 10., 1190/1., 1440558

