Difference between revisions of "East Breaks overburden rock"
Cwhitehurst (talk | contribs) |
|||
| Line 26: | Line 26: | ||
==Rate of accumulation== | ==Rate of accumulation== | ||
<gallery mode=packed heights=300px widths=300px> | <gallery mode=packed heights=300px widths=300px> | ||
| − | File:Sedimentary-basin-analysis_fig4-32.png|{{figure number|3}}Rock thickness vs. time plot for nine key wells south of east- ern Louisiana within the area of the 6–4 Ma depocenter. After Piggott and Pulham;<ref name=PP>Piggott, N., and A. Pulham, 1993, Sedimentation rate as the control on hydrocarbon sourcing, generation, and migration in the deepwater Gulf of Mexico: Proceedings, Gulf Coast Section SEPM 14th Annual Research Conference, p. 179–191.</ref> courtesy Gulf Coast SEPM | + | File:Sedimentary-basin-analysis_fig4-32.png|{{figure number|3}}Rock thickness vs. time plot for nine key wells south of east- ern Louisiana within the area of the 6–4 Ma [[depocenter]]. After Piggott and Pulham;<ref name=PP>Piggott, N., and A. Pulham, 1993, Sedimentation rate as the control on hydrocarbon sourcing, generation, and migration in the deepwater Gulf of Mexico: Proceedings, Gulf Coast Section SEPM 14th Annual Research Conference, p. 179–191.</ref> courtesy Gulf Coast SEPM |
File:Sedimentary-basin-analysis_fig4-33.png|{{figure number|4}}Rock accumulation rates for the Green Canyon 166 No. 1 well, as a histogram (lower graph) and as a set of burial history curves (upper graph). After Piggott and Pulham;<ref name=PP /> courtesy Gulf Coast SEPM. | File:Sedimentary-basin-analysis_fig4-33.png|{{figure number|4}}Rock accumulation rates for the Green Canyon 166 No. 1 well, as a histogram (lower graph) and as a set of burial history curves (upper graph). After Piggott and Pulham;<ref name=PP /> courtesy Gulf Coast SEPM. | ||
</gallery> | </gallery> | ||
Revision as of 18:20, 9 December 2015
| Exploring for Oil and Gas Traps | |

| |
| Series | Treatise in Petroleum Geology |
|---|---|
| Part | Critical elements of the petroleum system |
| Chapter | Sedimentary basin analysis |
| Author | John M. Armentrout |
| Link | Web page |
| Store | AAPG Store |
Overburden rock is the total stratigraphic section above the source rock.[1] The thickness and age of overburden rock provides a history of the rate of burial of a source rock toward and through the increasing temperature domains of the basin. This includes the range of temperatures necessary for cracking kerogens into hydrocarbons. (See also Kerogen type and hydrocarbon generation.)
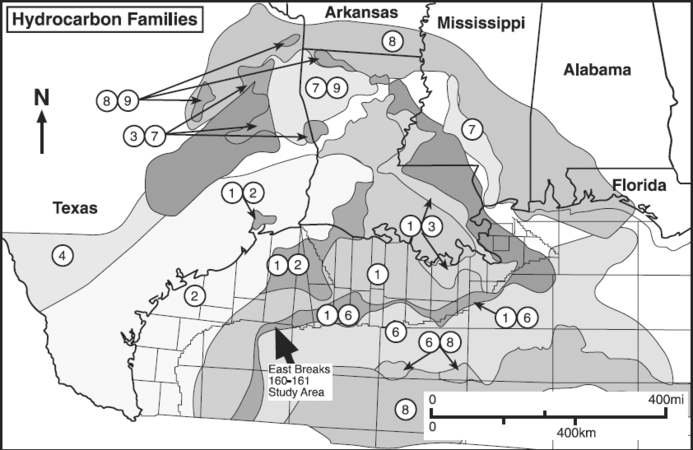
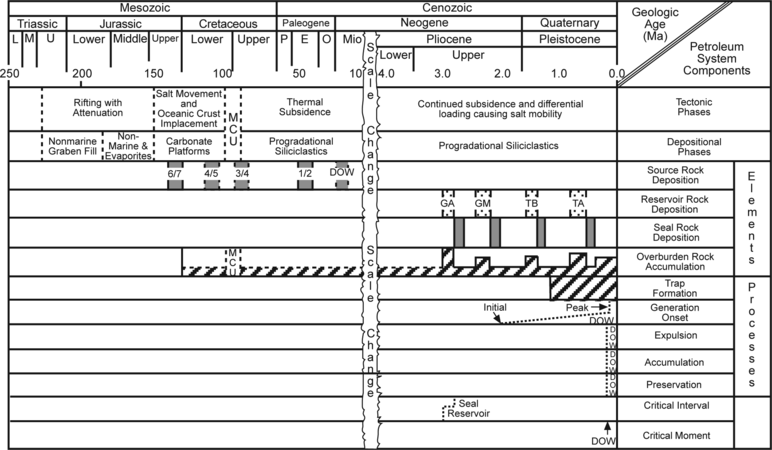
Because the depth to the probable source rocks of the East Breaks 160-161 field hydrocarbons is unknown, multiple working hypotheses must be considered. Four intervals of identified source rock are reported by Gross et al.[2] (Figure 1) and are plotted on Figure 2. Also plotted is the speculated middle Miocene source rock of Dow et al.[3] Gross et al.[2] consider the petroleum of the East Breaks area to have been sourced by Jurassic marine mudstones for the oil and Paleogene marine mudstones for the gas. Alternatively, Dow et al.[3] suggest middle Miocene marine mudstones as the probable source rock, although Taylor and Armentrout[4] believe the source rock facies to be older than the Miocene slope mudstones.
Figure 1 Map of hydrocarbon types based on analyses of more than 2000 oil, 600 gas, and 1200 seep samples correlated to specific source rocks. Modified from Gross et al.[2]
Rate of accumulation
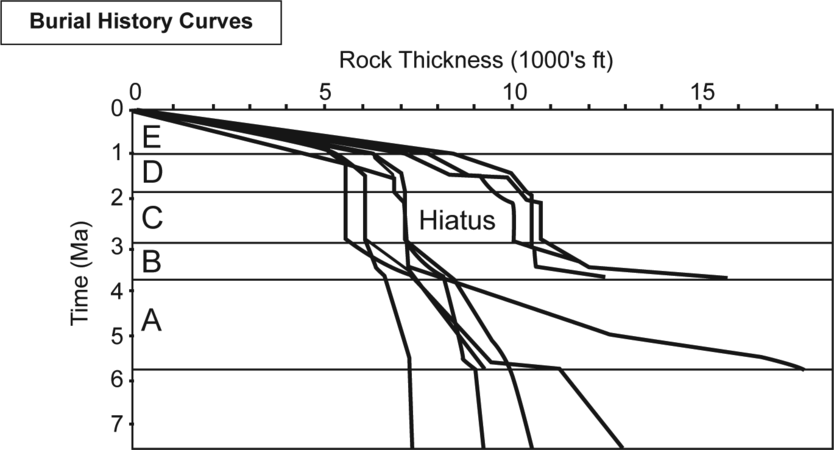
Figure 3 Rock thickness vs. time plot for nine key wells south of east- ern Louisiana within the area of the 6–4 Ma depocenter. After Piggott and Pulham;[6] courtesy Gulf Coast SEPM
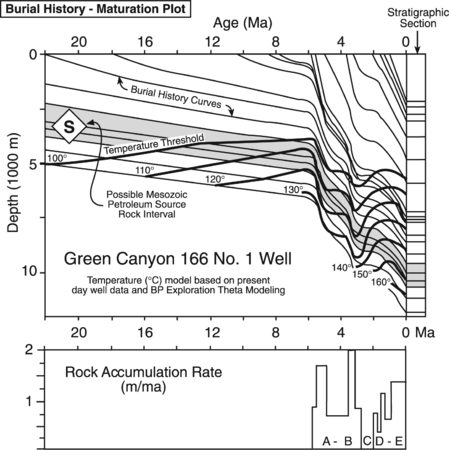
Figure 4 Rock accumulation rates for the Green Canyon 166 No. 1 well, as a histogram (lower graph) and as a set of burial history curves (upper graph). After Piggott and Pulham;[6] courtesy Gulf Coast SEPM.
Accumulation of overburden above these five potential source rocks is shown by a dashed line on the events chart (Figure 2), indicating no specific rate of accumulation until the interval of late Pliocene to Holocene sedimentation where rate variation is shown as defined by Piggott and Pulham.[7] Figures 3 and 4 indicate a major increase in rate of sediment accumulation occurred 6 Ma, which would accelerate burial of potential source rocks into the thermal zone for hydrocarbon generation.
Amount
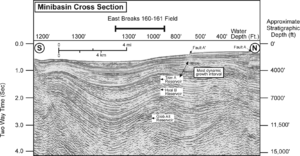
Drilling has documented that the East Breaks depocenter in the vicinity of the 160-161 field contains at least depth::15,000 ft (5000 m) of upper Miocene to Holocene sediment (Figure 5). Dow et al.[3] use this thickness in calculating maturation and generation models. The thickness of overburden rock for any one of the older potential source rock intervals will be greater than depth::15,000 ft (5000 m), but the exact amount is highly speculative.
See also
- East Breaks petroleum system
- East Breaks reservoir rock
- East Breaks seal rock
- East Breaks source rock
References
- ↑ Magoon, L. B., and W. G. Dow, 1994, The Petroleum System--From Source to Trap: AAPG Memoir 60, p. 3–24.
- ↑ 2.0 2.1 2.2 Gross, O. P., K. C. Hood, L. M. Wenger, and S. C. Harrison, 1995, Seismic imaging and analysis of source and migration within an integrated hydrocarbon system study, northern Gulf of Mexico basin: Abstracts, 1st Latin American Geophysical conference, p. 1–4.
- ↑ 3.0 3.1 3.2 3.3 Dow, W. G., M. A. Yukler, J. T. Senftle, M. C. Kennicutt, and J. M. Armentrout, 1990, Miocene oil source beds in the East Breaks basin, Flex-Trend, offshore Texas: Proceedings, Gulf Coast Section SEPM 9th Annual Research conference, p. 139–150.
- ↑ Taylor, G. S., and J. M. Armentrout, 1990, Rock geochemistry and relationships to produced oils from upper Pliocene turbidites, High Island area, Gulf of Mexico: Proceedings, Gulf Coast Section SEPM 9th Annual Research conference, p. 151–161.
- ↑ Haq, B., J. Hardenbol, and P. R. Vail, 1988, Mesozoic and Cenozoic chronostratigra- phy and cycles of sea-level change: SEPM Special Publication 42, p. 71–108.
- ↑ 6.0 6.1 Piggott, N., and A. Pulham, 1993, Sedimentation rate as the control on hydrocarbon sourcing, generation, and migration in the deepwater Gulf of Mexico: Proceedings, Gulf Coast Section SEPM 14th Annual Research Conference, p. 179–191.
- ↑ Piggott, N., and A. Pulham, 1993, Sedimentation rate as the control on hydrocarbon sourcing, generation, and migration in the deepwater Gulf of Mexico: Proceedings, Gulf Coast Section SEPM 14th Annual Research conference, p. 179–191.
