Charge volume
The volume of hydrocarbons expected to be delivered to a trap is an important risk parameter. This section covers methodology and information to calculate the hydrocarbon charge volume parameter.
Volume constraining factors[edit]
Certain factors constrain the amount of hydrocarbon delivered to a trap. These factors can be divided into two groups, as shown below.
| Source rock factors | Migration factors |
|---|---|
| Drainage area | Lateral migration distance |
| Thickness | Vertical migration distance |
| Potential ultimate yield | Lateral migration factor <xref ref-type="table-fn" rid="ch07tblfn1"> * </xref> |
| Yield fraction timing | Vertical migration factor <xref ref-type="table-fn" rid="ch07tblfn1"> * </xref> |
Procedure[edit]
The table below lists a procedure for estimating the volume of migrated hydrocarbons available to fill a trap.
| Step | Action |
|---|---|
| 1 | Calculate the volume of hydrocarbons generated by the source rock, using the formula V = A × T × Y × M, where:
|
| 2 | Estimate the proportion of the source rock that supplied hydrocarbons to the area in which the trap is located (drainage area). Use a map of the mature source rock. |
| 3 | Estimate the efficiency of the migration process. For example, did 20% of the generated hydrocarbons travel from the source rock to the trap? |
| 4 | Calculate the volume of migrated hydrocarbons available to fill the trap |
Estimating drainage area[edit]
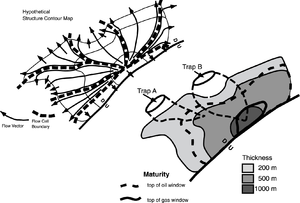
It is important to make a migration map showing the location of the source rock facies and the drainage areas that feed the areas of interest. The map is best drawn for the time when maturation analysis indicates the hydrocarbons should be migrating. A rougher estimate can be made from a map or the stucture as it exists today. A drainage map is made from the migration map. It should include estimates of maturity and hydrocarbon yield in an appropriate number of area classes. Subareas within these classes are defined by thickness and yield variation within the total drainage area.
Example drainage map[edit]
Figure 1 is a hypothetical migration pathway map. The lower map shows the thickness of source rock, the top of the oil and gas windows, and the drainage areas for two traps labeled A and B of the same area shown in the upper map. The drainage areas for traps A and B were made using the migration pathway map.
Example of calculating volume[edit]
The table below gives an example of calculating hydrocarbon charge volume for traps A and B. The volume of expelled hydrocarbons is calculated using V = A × T × Y × M. Estimation of charge volumes for the two traps (A and B) are made as follows.
| Factor | Trap A | Trap B |
|---|---|---|
| Area 3 (1000-m-thick mature source rock) | 0 km2 | 50 km2 |
| Yield/volume of source in area 1 | 0.2 bbl/m3 | 0.2 bbl/m3 |
| Total volume generated in area 1 | 0 bbl | 10 billion bbl |
| Area 2 (500-m-thick mature source rock) | 10 km2 | 350 km2 |
| Yield/volume of source in area 2 | 0.1 | 0.1 |
| Total volume generated in area 2 | 0.5 billion bbl | 17.5 billion bbl |
| Area 3 (200-m-thick mature source rock) | 40 km2 | 10 km2 |
| Yield/volume of source in area 3 | 0.02 | 0.02 |
| Total volume generated in area 3 | 0.16 billion bbl | 0.04 billion bbl |
| Total generated (areas 1 + 2 + 3) | 0.66 billion bbl | 27.54 billion bbl |
| Migration effeciency | 10% | 10% |
| Volume available for charge | 0.066 billion bbl | 2.754 billion bbl |
Charge volume classification[edit]
Because of the uncertainties in estimating the charge volume, these estimates are often compared to the estimate of reservoir pore volume within the trap. The following classification is suggested.
Overcharged trap[edit]
Charge volume exceeds one order of magnitude of the trap pore volume. It is likely that significant volumes of hydrocarbons have been spilled from the trap.
Fully charged trap[edit]
Charge volume within plus or minus one order of magnitude of the trap pore volume. It is unlikely that significant volumes of hydrocarbons have been spilled from the trap.
Undercharged trap[edit]
Charge volume is less than one order of magnitude of the trap pore volume. No hydrocarbons are likely to have been spilled from the trap.
See also[edit]
- Calculating migration rate and charge volume
- Calculating migration rate
- Estimating expulsion efficiency
