Reducing exploration risk
| Exploring for Oil and Gas Traps | |

| |
| Series | Treatise in Petroleum Geology |
|---|---|
| Part | Traps, trap types, and the petroleum system |
| Chapter | Petroleum systems |
| Author | Leslie B. Magoon, Edward A. Beaumont |
| Link | Web page |
| Store | AAPG Store |
In exploration, the general question is Where can we find substantial quantities of hydrocarbons that are economical to produce? To solve this problem, exploration geologists find and evaluate a prospect. In addition to helping evaluate petroleum charge, trap, and timing, the petroleum system concept can help in the exploration process by determining exploration intensity and assessing risk.
Play
A play is one or more prospects that may define a profitable accumulation of undiscovered petroleum. Traditionally, a play is developed and evaluated without any particular petroleum system in mind. For example, if a prospect (play) is identified near a series of oil fields in anticlinal traps, it could be argued—using geophysics and geochemistry—that the prospect is an anticlinal trap charged with the same oil.
Three independent variables—petroleum charge (fluids), trap (sedimentary rocks), and timing (time)—are usually evaluated. Petroleum charge is the volume and characteristics of the oil and gas available to the trap, if it exists. The trap includes the reservoir and seal rocks and the trapping geometry formed by the reservoir–seal interface. Timing is whether the trap formed before the petroleum charge entered the trap.
Each independent variable has equal weight because if any variable is absent (0), the prospect is a failure; if all variables are present (1.0), the prospect is a commercial success. Therefore, each independent variable can be evaluated on a scale of zero to one (0–1.0). Exploration risk is determined by multiplying the three variables: charge, trap, and timing.
Within each independent variable, a series of subevents (which are also independent) must be evaluated. For example, if a trap is to be evaluated, the reservoir rock must be mapped carefully and its properties predicted using geologic principals. A similar procedure is carried out for the seal and trapping geometry. These subevents must be reduced to a single number between 0 and 1.0 that represents the independent variable, the trap. The subevents that contribute to petroleum charge and timing should also be evaluated in a similar manner.
A practical way to carry out this exercise is to first map the petroleum system so the knowledge about the system can be used to evaluate the complementary play.
Complementary play

The complementary play evaluates the exploration risk for finding undiscovered hydrocarbons associated with a particular petroleum system.
First, the petroleum system case study is completed. As the case study develops, an idea(s) or play(s) that involves this petroleum system will occur to the investigator. This play complements the petroleum system because it could add hydrocarbons (if discovered) to the system.
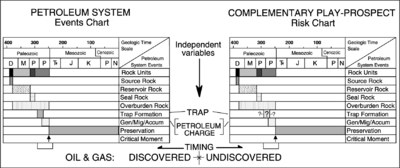
The events chart in Figure 1 shows how the risk chart for the complementary play (prospect) is related to the petroleum system vis-a-vis the three independent variables—trap, petroleum charge, and timing.
The experience acquired while executing the petroleum system case study provides the measure of difficulty in mapping and determining the age of the essential elements and, more importantly, for the two processes—trap formation and generation-migration-accumulation of petroleum. Obviously, there is no risk or uncertainty related to the discovered accumulations in the petroleum system, but there are varying levels of difficulty in the reconstruction of events that caused these accumulations. This measure of difficulty can be incorporated into the risk chart.
For example, geologic and geophysical information for the producing fields indicates the traps are easily mapped and the time of formation is narrowly constrained. However, this same type of information over the geographic extent of the petroleum system indicates these types of traps have all been tested successfully and the only prospects left are ones that are more difficult to map and date; hence, their relative risk increases.
Using the risk chart in this manner allows the investigator and prospect evaluator an opportunity to separate what is known on the events chart from what is unknown on the risk chart for the prospect.
Assigning risk
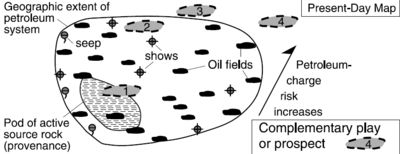
A petroleum system map can be used to evaluate the time and volume of hydrocarbon charge or to assign risk to a complementary play or prospect by using its position relative to the geographic extent of the system.
Least to most risk

Using Figure 2 and stipulating that the complementary play is on the migration path for this petroleum system, a play located within or outside the geographic extent of the system has the following level of risk:
- Least risk; accumulations surround the trap.
- Some risk; accumulations located on three sides.
- Riskier; accumulations located on only one side.
- Most risk; accumulations distant from prospect.
Studies of the reservoir rock and seal rock as well as trap formation are needed to evaluate migration paths and traps.
Exploration intensity
In a petroleum province, drilling density usually indicates how intensively an area has been explored. Though this is a relative measure, a petroleum province having one exploratory well every square kilometer is well explored compared with a province that has one well every 100 km2. Exploration intensity by province ranges from lightly to moderately to heavily explored. However, in a petroleum province with overlapping petroleum systems, the shallowest petroleum system may be heavily explored compared with the deeper petroleum systems. To determine level of exploration, each petroleum system in the province of interest should be mapped and the size and location of the commercial accumulations compared with the dry exploratory wells. The dry-hole ratio or success ratio determines exploration intensity and success.
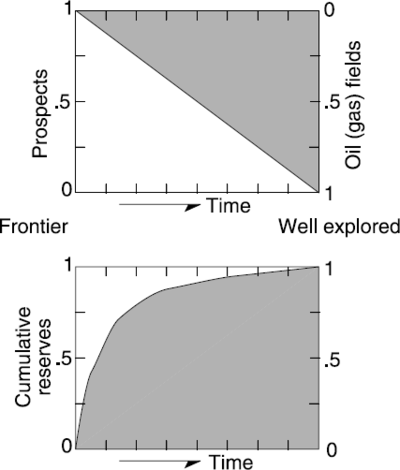
The graphs in Figure 3 conceptually summarize the exploration process relative to time. The top graph shows that a frontier petroleum province or petroleum system starts with only prospects (1.00 or 100%); with time, some or all (shown here) of those prospects become oil (gas) fields. The bottom graph shows that the highest percentage of the cumulative petroleum reserves are found early in the exploration process. The quicker we determine the size and extent of a petroleum system, the more likely we will be able to decide whether to continue drilling exploratory wells.
