Seismic data: identifying reflectors
| Exploring for Oil and Gas Traps | |

| |
| Series | Treatise in Petroleum Geology |
|---|---|
| Part | Predicting the occurrence of oil and gas traps |
| Chapter | Interpreting seismic data |
| Author | Christopher L. Liner |
| Link | Web page |
| Store | AAPG Store |
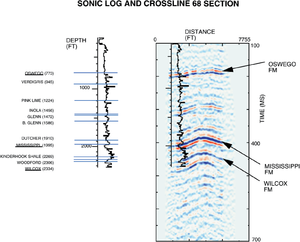
Whether using VSP, synthetic seismogram, or log overlay, the final step is to compare the object to seismic traces in the vicinity of the well and find a fit.
Example
In the figure below, a sonic log has been converted to time and velocity. Note that the time axis on the seismic section and the converted sonic log are linear, while the depth tick marks on the sonic are nonlinear. The geological horizons annotated on the sonic log are located via the depth tics from picks on other logs (electric, gamma ray, etc.). It is important to realize that a sonic log never goes to the surface; there is always a gap for the surface casing. So we do not expect time zero on the converted log to fit at time zero on the seismic section. In practice, the log is placed over the seismic section and shifted vertically until we are satisfied with the fit.
