Search results
Jump to navigation
Jump to search
There is a page named "Reservoir" on this wiki. See also the other search results found.
Page title matches
File:Predicting-reservoir-system-quality-and-performance fig9-74.png (1,681 × 1,119 (123 KB)) - 21:38, 31 January 2014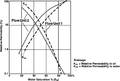
File:Predicting-reservoir-system-quality-and-performance fig9-21.png (1,100 × 739 (52 KB)) - 20:21, 31 January 2014
File:Predicting-reservoir-system-quality-and-performance fig9-53.png (1,060 × 430 (29 KB)) - 21:08, 31 January 2014
File:Predicting-reservoir-system-quality-and-performance fig9-85.png (962 × 722 (143 KB)) - 21:55, 31 January 2014
File:Predicting-reservoir-system-quality-and-performance fig9-32.png (1,144 × 1,075 (317 KB)) - 20:39, 31 January 2014
File:Predicting-reservoir-system-quality-and-performance fig9-64.png (1,229 × 981 (592 KB)) - 21:24, 31 January 2014
File:Predicting-reservoir-system-quality-and-performance fig9-96.png (1,057 × 1,017 (99 KB)) - 22:11, 31 January 2014
File:Predicting-reservoir-system-quality-and-performance fig9-10.png (847 × 761 (203 KB)) - 17:04, 31 January 2014
File:Predicting-reservoir-system-quality-and-performance fig9-43.png (1,340 × 979 (95 KB)) - 20:54, 31 January 2014
File:Predicting-reservoir-system-quality-and-performance fig9-75.png (1,658 × 1,324 (204 KB)) - 21:39, 31 January 2014
File:Predicting-reservoir-system-quality-and-performance fig9-22.png (1,616 × 760 (95 KB)) - 20:23, 31 January 2014
File:Predicting-reservoir-system-quality-and-performance fig9-54.png (929 × 1,437 (116 KB)) - 21:11, 31 January 2014
File:Predicting-reservoir-system-quality-and-performance fig9-86.png (977 × 745 (105 KB)) - 21:56, 31 January 2014
File:Predicting-reservoir-system-quality-and-performance fig9-33.png (2,000 × 1,403 (1.85 MB)) - 20:40, 31 January 2014
File:Predicting-reservoir-system-quality-and-performance fig9-65.png (1,216 × 968 (596 KB)) - 21:25, 31 January 2014
File:Predicting-reservoir-system-quality-and-performance fig9-97.png (1,658 × 1,158 (213 KB)) - 22:12, 31 January 2014
File:Predicting-reservoir-system-quality-and-performance fig9-11.png (1,216 × 996 (143 KB)) - 17:06, 31 January 2014
File:Predicting-reservoir-system-quality-and-performance fig9-44.png (1,569 × 792 (131 KB)) - 20:55, 31 January 2014
File:Predicting-reservoir-system-quality-and-performance fig9-76.png (1,394 × 961 (78 KB)) - 21:42, 31 January 2014
File:Predicting-reservoir-system-quality-and-performance fig9-23.png (1,364 × 1,129 (175 KB)) - 20:24, 31 January 2014


Page text matches
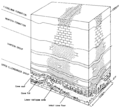
File:Carbonate-reservoir-models-facies-diagenesis-and-flow-characterization fig4.png Schematic diagram of the karst-collapse reservoir model showing three karst facies. (From Kerans, 1989.)(1,827 × 1,643 (189 KB)) - 19:02, 13 January 2014
File:Reserves-estimation fig3.png [[Category:Reservoir engineering methods]](1,906 × 1,312 (92 KB)) - 18:45, 14 January 2014
File:Mth14ch02f08.jpg ...rnia in AAPG Methods in Exploration No. 14: Horizontal Wells: Focus on the Reservoir, Edited by T. R. Carr, E. P. Mason, and C. T. Feazel.(400 × 465 (28 KB)) - 20:19, 4 December 2015
File:Core-alteration-and-preservation fig1.png {{copyright|reservoir to surface. (a)Oil-productive formation. (b) Gas-productive formation. (Cou Typical fluid contents. Copyright: reservoir to surface. (a)Oil-productive formation. (b) Gas-productive formation. (Cou(1,954 × 1,054 (65 KB)) - 22:38, 13 January 2014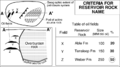
File:Petroleum-systems fig3-1.png The figure below shows how a reservoir rock name is selected.(844 × 468 (37 KB)) - 17:10, 17 January 2014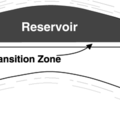
File:MainPageReservoirSystem.png Main Page image for the Reservoir system article.(200 × 200 (15 KB)) - 17:35, 5 January 2015
File:Conducting-a-reservoir-simulation-study-an-overview fig3.png [[Category:Reservoir engineering methods]](926 × 1,188 (30 KB)) - 18:46, 14 January 2014
File:Mth14ch02f04.jpg ...rnia in AAPG Methods in Exploration No. 14: Horizontal Wells: Focus on the Reservoir, Edited by T. R. Carr, E. P. Mason, and C. T. Feazel.(500 × 605 (114 KB)) - 15:58, 4 December 2015
File:Mth14ch02f01.jpg ...rnia in AAPG Methods in Exploration No. 14: Horizontal Wells: Focus on the Reservoir, Edited by T. R. Carr, E. P. Mason, and C. T. Feazel.(700 × 457 (103 KB)) - 23:18, 3 December 2015
File:Mth14ch02f07.jpg ...rnia in AAPG Methods in Exploration No. 14: Horizontal Wells: Focus on the Reservoir, Edited by T. R. Carr, E. P. Mason, and C. T. Feazel.(700 × 449 (53 KB)) - 19:56, 4 December 2015
File:Using-and-improving-surface-models-built-by-computer fig21.png Thickness Is normally defined by grids representing the top and base of reservoir and the fluid contact(s).(881 × 484 (19 KB)) - 22:33, 13 January 2014
File:Geological-heterogeneities fig4.png Synthetic reservoir cross section showing the vertical and lateral distribution of shales (blac(946 × 521 (47 KB)) - 15:34, 14 January 2014
File:Mth14ch02f05.jpg ...rnia in AAPG Methods in Exploration No. 14: Horizontal Wells: Focus on the Reservoir, Edited by T. R. Carr, E. P. Mason, and C. T. Feazel.(500 × 682 (64 KB)) - 17:07, 4 December 2015
File:Mthch02f02.jpg ...rnia in AAPG Methods in Exploration No. 14: Horizontal Wells: Focus on the Reservoir, Edited by T. R. Carr, E. P. Mason, and C. T. Feazel.(300 × 453 (36 KB)) - 15:19, 4 December 2015
File:Thin-section-analysis fig1.png ...porosity types in sandstones summarizing the influence of porosity type on reservoir quality. (Modified after Pittman, 1979.)(933 × 870 (15 KB)) - 21:07, 14 January 2014
File:Fluid-contacts fig4.png ...luid contacts. (a) Capillary pressure curves for facies A and B within the reservoir. The dashed line corresponds to the saturation trend of the well In part (b(1,924 × 933 (108 KB)) - 01:52, 14 January 2014
File:Waterflooding fig3.png [[Category:Reservoir engineering methods]](949 × 944 (54 KB)) - 19:18, 14 January 2014
File:Waterflooding fig4.png [[Category:Reservoir engineering methods]](937 × 927 (20 KB)) - 19:18, 14 January 2014
File:GumelarFigure7.jpg Plot of parameter relationship with formation ability for sealing capacity in reservoir (a) Clay Smear Potential; (b) Shale Gouge Ratio; (c) Shale Smear Factor (Yi(880 × 256 (64 KB)) - 17:25, 29 September 2021
File:Evaluating-tight-gas-reservoirs fig3.png ...ge porosity values and (b) average permeability values for cored tight gas reservoir facies. (From Moslow and Tillman, 1989.)(1,964 × 879 (37 KB)) - 18:47, 14 January 2014


