Magnetics: total intensity and residual magnetic maps
| Exploring for Oil and Gas Traps | |

| |
| Series | Treatise in Petroleum Geology |
|---|---|
| Part | Predicting the occurrence of oil and gas traps |
| Chapter | Using magnetics in petroleum exploration |
| Author | Edward A. Beaumont, S. Parker Gay |
| Link | Web page |
| Store | AAPG Store |
Magnetic variation or susceptibility may be analyzed using either total intensity or residual maps. Magnetic residual maps reveal much more detailed geologic features—in particular, the geometry and configuration of individual basement blocks. They bring out the subtle magnetic anomalies that result from the changes in rock type across basement block boundaries. Total intensity maps show larger scale geologic features, such as basin shape or anomalous rock types deep within the basement.
What is total intensity?
Total intensity is the measurement from the magnetometer after a model of the earth's normal magnetic field is removed. It is generally a reflection of the average magnetic susceptibility of broad, large-scale geologic features.
What is residual?

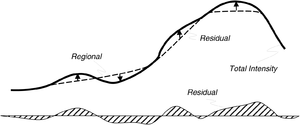
Residual is what remains after regional magnetic trends are removed from the total intensity Residual maps show local magnetic variations, which may have exploration significance. The regional trend of the total intensity can be calculated using a number of techniques, including running averages, polynomials, low-pass filters, or upward continuation techniques. Figure 1 shows magnetic profiles of total intensity, regional trend, and residual.
Total intensity and residual map example
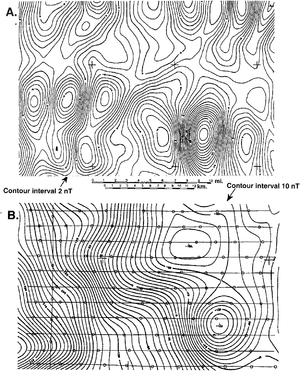
The maps in Figure 2 are examples of a residual map (A) that was calculated from the total intensity magnetic map (B). The grid and small circles on the total intensity map are the flight path lines [approximately length::2 km (1.2 mi) apart] and location points for the flight lines. The total intensity map strikingly does not resemble the residual map and would be of limited value for delineating basement fault blocks.
Total intensity magnetics responds to rock types over broad areas as well as those deep within the crust. We can see by a careful examination of map B, however, that many of the features shown by the residual map are vaguely apparent in the total intensity data. Fortunately, we no longer have to interpret such total intensity maps in petroleum basins because many enhancement techniques employing residuals, derivatives, polynomials, or downward continuation exist to reveal the subtle magnetic anomalies that result from the changes in rock type across basement block boundaries.
See also
References
- ↑ Nettleton, 1962, Elementary Gravity and Magnetics for Geologists and Seismologists: Society of Exploration Geophysicists Monograph Series 1, 121 p.
